[blackcat] L5 Alchemy Gold (ALGOLD)
It is shaping up to be quite comprehensive. It includes:
- - An adaptive filter for smoothing price and volume data.
- - A volatility filter based on Average True Range (ATR).
- - A trigger moving average for generating smoothed price information.
- - An ALMA (Arnaud Legoux Moving Average) for further filtering of price and volume.
- - A divergence detector to identify potential trend reversals.
Entry Criteria: A composite crossover and crossunder of the fast and slow lines of the ALGOLD oscillator.
Exit Criteria: A crossover and crossunder of the fast and slow lines of the ALGOLD oscillator, but using a lower time frame for more sensitivity.
The input parameters of "[blackcat] L5 Alchemy Gold (ALGOLD)" indicator, are categorized into three groups:
Group 1, Alchemy Setting:
- Alchemy Sharpness (Default: 7) - Controls the sharpness of the adaptive filter.
- Alchemy Period (Default: 55) - Determines the smoothness of the oscillator.
Group 2, DVATAR Setting:
- DVATR Length (Default: 11) - Sets the period length for the DVATR, similar to ATR's Length.
- DVATR Threshold (Default: 0.07) - Adjusts sensitivity for sideways market detection.
- Smooth Length (Default: 21) - Smoothens the DVATR output, balancing with volatility detection.
Group 3, Divergence Setting:
- Parameters like Pivot Lookback, Max/Min of Lookback Range - Sets the sensitivity for divergence detection.
- Options to enable or disable plots for various types of divergence (Bullish, Hidden Bullish, Bearish, Hidden Bearish).
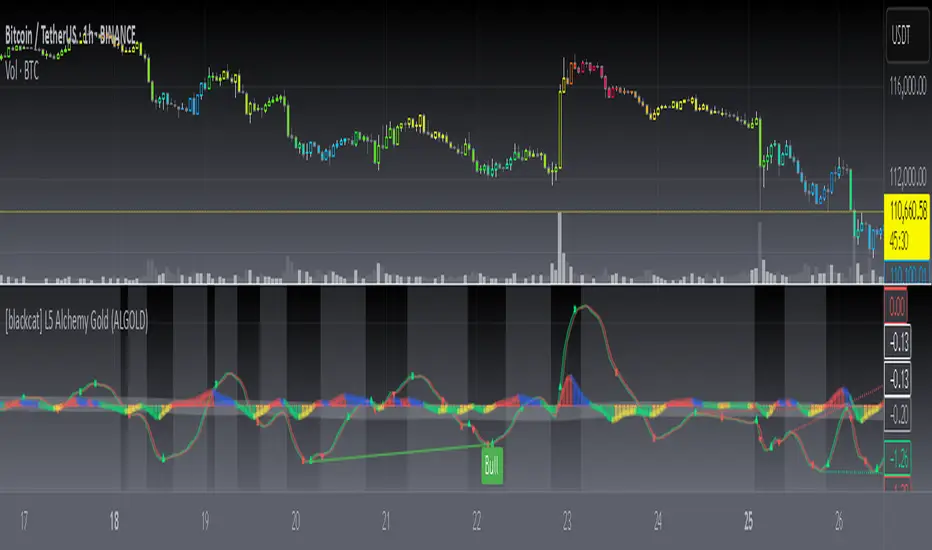
"[blackcat] L5 Alchemy Gold (ALGOLD)" indicator are vivid and intuitive:
Candle Bar Color:
Gradient color changes to indicate trend strength, with warmer colors for bullish and cooler colors for bearish trends.
Line Colors and Shapes:
- Green color represents the fast line, red for the slow line.
- Crosses of these lines signal entries (triangles) and exits (cross shapes).
- A band is created between these lines, filled with green for uptrends and red for downtrends.
Histogram:
- Red histogram for above 0 and uptrend.
- Blue histogram for above 0 and retracement.
- Green histogram for below 0 and downtrend.
- Yellow histogram for below 0 and bounce-up.
Skrypt tylko na zaproszenie
Dostęp do tego skryptu mają wyłącznie użytkownicy zatwierdzeni przez autora. Aby z niego korzystać, należy poprosić o zgodę i ją uzyskać. Zgoda jest zazwyczaj udzielana po dokonaniu płatności. Więcej informacji można znaleźć w instrukcjach autora poniżej lub kontaktując się bezpośrednio z blackcat1402.
TradingView NIE zaleca płacenia za skrypt ani korzystania z niego, jeśli nie ma pełnego zaufania do jego autora i nie rozumie się zasad jego działania. Można również znaleźć darmowe, otwartoźródłowe alternatywy w skryptach społeczności.
Instrukcje autora
Wyłączenie odpowiedzialności
Skrypt tylko na zaproszenie
Dostęp do tego skryptu mają wyłącznie użytkownicy zatwierdzeni przez autora. Aby z niego korzystać, należy poprosić o zgodę i ją uzyskać. Zgoda jest zazwyczaj udzielana po dokonaniu płatności. Więcej informacji można znaleźć w instrukcjach autora poniżej lub kontaktując się bezpośrednio z blackcat1402.
TradingView NIE zaleca płacenia za skrypt ani korzystania z niego, jeśli nie ma pełnego zaufania do jego autora i nie rozumie się zasad jego działania. Można również znaleźć darmowe, otwartoźródłowe alternatywy w skryptach społeczności.