Trend Following Scalper 3 Time Framse
If you think that it would be a good idea, this is the script that you are looking for.
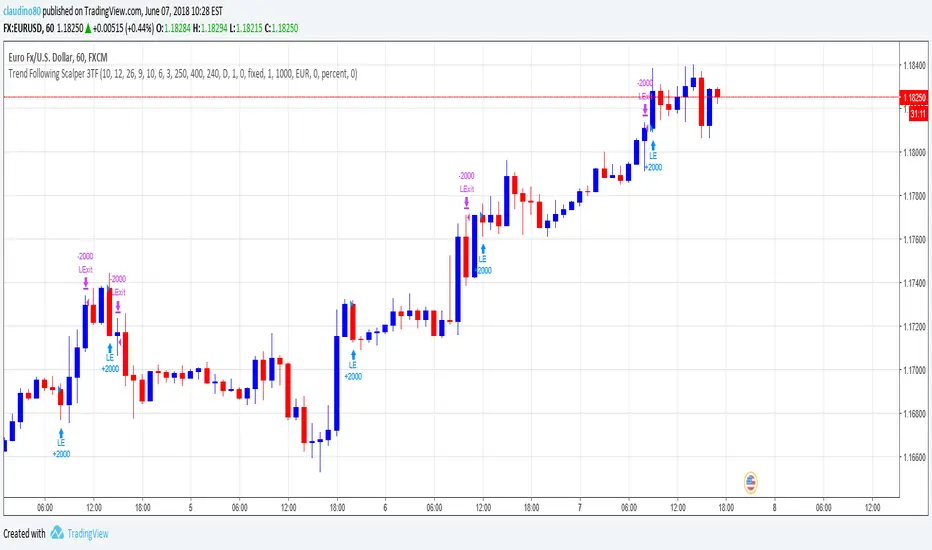
The Trend Following Scalper (3 Time Frames) script has been developed to automate the trading activity by detecting a new trend and by scalping a fixed amount of pips each trade. That is why it is called Trend Following Scalper.
How does the script detect the new trend?
The beginning of the new trend is detected on the lower timeframe (1H is the suggested one) by joining the information of the Stochastic, MACD and Exponential Moving Average.
Once a potential trade has been detected on lower timeframe, the script confirms it by looking the upper timeframe (e.g. Daily + H4) by gathering the same indicator / parameter information.
If the threes timeframes are moving in the same direction, the script open a new trade.
Why do we need to merge lower and higher timeframe before open the trade?
The lower timeframe shows a shorter Price Action context. The short price action context has a short life! By looking at the higher time frames context the script tries to exclude the short life counter-trend moves. At the end, a new trade is open only if the higher timeframe context supports the lower timeframe indication.
What about the Risk-Reward (following RR) ratio?
The RR is set by default as 1.6 (stop loss 25 pips and take profit 40 pips).
This configuration has been heavily tested on multiple crosses and it has shown a good Equity Line with a low Drawdown.
(Note: the stop loss and take profit can be changed by the user via the parameter pages. Suggest RR > 1.5)
What about the accuracy of the Script?
The average script accuracy is > 55% on the H1 time frame (tested with various crosses).
With this accuracy, and by risking 0.6% of the capital each trade, your capital will grow > 25% every 100 trades.
What about the drawdown?
It depends on the capital and the size of the position used on each trade.
For example, with an initial capital of 1000 Euros and by risking 0.6% of the capital each trade, the drawdown is close to 3%.
(The strategy tester result has been calculated starting from January 2017. The strategy produced 527E (i.e. 52% gain) starting from a 1000E capital and risking 0.5% each trade)
Do you want to try the script? Please write me!
Do you have some question? Please write me!
Skrypt tylko na zaproszenie
Tylko użytkownicy zatwierdzeni przez autora mogą uzyskać dostęp do tego skryptu. Musisz złożyć prośbę i uzyskać zgodę na jego użycie. Zazwyczaj jest ona udzielana po dokonaniu płatności. Aby uzyskać więcej informacji, postępuj zgodnie z instrukcjami autora poniżej lub skontaktuj się bezpośrednio z claudino80.
TradingView NIE zaleca płacenia za skrypt ani jego używania, jeśli nie masz pełnego zaufania do jego autora i nie rozumiesz, jak działa. Możesz także znaleźć darmowe, open-source'owe alternatywy w naszej sekcji skryptów społecznościowych.
Instrukcje autora
Wyłączenie odpowiedzialności
Skrypt tylko na zaproszenie
Tylko użytkownicy zatwierdzeni przez autora mogą uzyskać dostęp do tego skryptu. Musisz złożyć prośbę i uzyskać zgodę na jego użycie. Zazwyczaj jest ona udzielana po dokonaniu płatności. Aby uzyskać więcej informacji, postępuj zgodnie z instrukcjami autora poniżej lub skontaktuj się bezpośrednio z claudino80.
TradingView NIE zaleca płacenia za skrypt ani jego używania, jeśli nie masz pełnego zaufania do jego autora i nie rozumiesz, jak działa. Możesz także znaleźć darmowe, open-source'owe alternatywy w naszej sekcji skryptów społecznościowych.