PROTECTED SOURCE SCRIPT
Jesus Sheep Akash live and Market Price level NSE

Jesus Sheep Akash live and Market Price level NSE
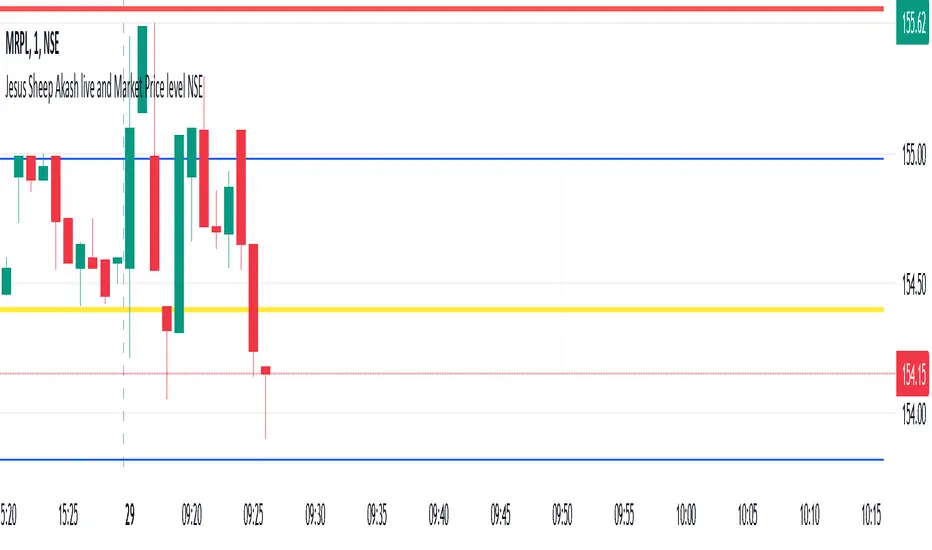
This Pine Script indicator is designed to assist traders by dynamically calculating and displaying key resistance and support levels based on market volatility (using the India VIX) and previous day's closing prices. It combines technical analysis principles with dynamic adjustments to account for changing market conditions.
Key Features:
Ticker Support:
Tracks both the India VIX (NSE:INDIAVIX) and the current market ticker.
Dynamic Resistance and Support Levels:
Calculates resistance and support levels based on the previous day's market close, adjusted dynamically using the VIX.
Includes half-resistance and half-support levels for intermediate targets.
Extends calculations to include additional resistance and support levels (up to four levels above and below).
Market Volatility Factor:
Integrates a volatility adjustment factor based on the 20-day standard deviation of prices, fine-tuning the calculated levels.
Real-Time Visualization:
Draws lines for:
Resistance levels (red lines).
Support levels (green lines).
Half-resistance and half-support (blue lines).
Highlights key price levels with labels on the chart.
Provides a dynamic table showing:
Current and previous day VIX.
Current price, price change, and previous close.
Alerts and Notifications:
Sends alerts when the market price crosses resistance or support levels, signaling potential trading opportunities.
Ease of Analysis:
Automatically updates lines and levels at the start of each trading session.
Provides a clear and structured view of key price points for informed decision-making.
Interactive Labeling:
Displays VIX data and previous day's closing value as a label near the chart for easy reference.
How to Use:
Trading Strategy:
Use the resistance levels as potential selling or shorting points.
Use support levels as potential buying or long entry points.
Monitor alerts for breakouts above resistance or breakdowns below support to identify significant market moves.
Customization:
Adjust daily_count or calculation parameters to match your specific market conditions or trading style.
Overlay Placement:
The indicator is designed to overlay directly on the chart for seamless integration with your technical analysis.
This indicator is ideal for traders looking to blend market sentiment (VIX) with precise price action analysis to identify trading opportunities dynamically.
Skrypt chroniony
Ten skrypt został opublikowany jako zamknięty kod źródłowy. Można z tego korzystać swobodnie i bez żadnych ograniczeń — więcej informacji znajduje się tutaj.
Wyłączenie odpowiedzialności
Informacje i publikacje nie stanowią i nie powinny być traktowane jako porady finansowe, inwestycyjne, tradingowe ani jakiekolwiek inne rekomendacje dostarczane lub zatwierdzone przez TradingView. Więcej informacji znajduje się w Warunkach użytkowania.