PROTECTED SOURCE SCRIPT
Zaktualizowano Simple Price Action [Luxmi AI]
Introducing the Simple Price Action Indicator
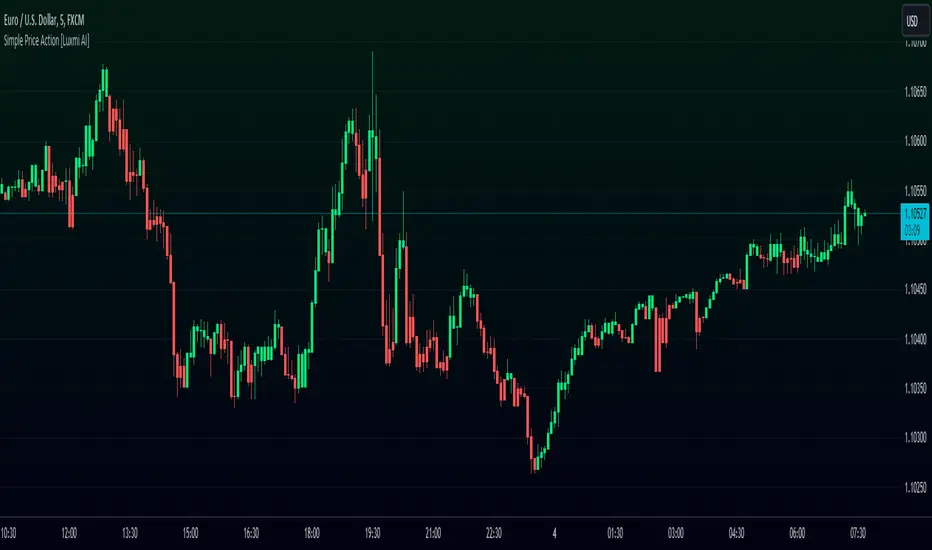
The Simple Price Action Indicator is designed to help traders quickly identify market trends and make informed decisions. This custom-built Pine Script tool changes candle colors on your chart based on price movement:
- Lime Green Candles indicate bullish momentum when the current price closes above the previous candle’s high.
- Red Candles signal bearish momentum when the price closes below the previous candle’s low.
Alongside these visual cues, the indicator generates Buy and Sell signals based on color changes:
- A buy signal appears when a red candle turns green.
- A sell signal shows up when a green candle turns red.
These signals are displayed directly on the chart as small labels ("B" for buy and "S" for sell), helping you easily spot trading opportunities. You can also set up alerts to notify you whenever a new signal is triggered, ensuring you never miss a trade.
The Simple Price Action Indicator is a straightforward yet effective tool for traders looking to enhance their price action analysis.
How It Works: Under the Hood
The script begins by defining two key colors—lime green for bullish candles and red for bearish candles. It then determines the candle color based on the closing price relative to the previous candle's high and low. If a bullish or bearish condition is met, the candle is colored accordingly.
Next, the script checks for a change in candle color to generate buy and sell signals. If a candle turns green after being red, a buy signal is plotted below the candle. If a candle turns red after being green, a sell signal is plotted above the candle.
Finally, the script includes alert conditions that correspond to these buy and sell signals, ensuring you can react quickly to potential trades.
Informacje o Wersji
Introducing features to color bars and enable/disable labels.Skrypt chroniony
Ten skrypt został opublikowany jako zamknięty kod źródłowy. Można z tego korzystać swobodnie i bez żadnych ograniczeń — więcej informacji znajduje się tutaj.
Wyłączenie odpowiedzialności
Informacje i publikacje nie stanowią i nie powinny być traktowane jako porady finansowe, inwestycyjne, tradingowe ani jakiekolwiek inne rekomendacje dostarczane lub zatwierdzone przez TradingView. Więcej informacji znajduje się w Warunkach użytkowania.
Skrypt chroniony
Ten skrypt został opublikowany jako zamknięty kod źródłowy. Można z tego korzystać swobodnie i bez żadnych ograniczeń — więcej informacji znajduje się tutaj.
Wyłączenie odpowiedzialności
Informacje i publikacje nie stanowią i nie powinny być traktowane jako porady finansowe, inwestycyjne, tradingowe ani jakiekolwiek inne rekomendacje dostarczane lub zatwierdzone przez TradingView. Więcej informacji znajduje się w Warunkach użytkowania.