PROTECTED SOURCE SCRIPT
Zaktualizowano Gann Cycle Indicator
Version "Beta 1.0.0"
The "Gann Cycle Indicator" helps you analyze market cycles, from the smaller ones to the bigger ones. It requires you to know how Gann used market cycles to trade efficently. It helps predict where to expect a minum or a maximum and where to expect the start of a new cycle. It works with any market and can be set up as you prefer. It takes some inputs to work properly:
1) Starting X: this is the offset on the X axis where all the cycles start from. Once you applied this indicator on your graph, you must adjust the starting position to match the start of the cycle you found on the graph.
2) Cycles (1 to 4). These are the period, expressed in candles number, of each cycles. "Cycle 1" (i.e 3,25 days) should be the smaller of the 4 while "Cycle 4" the bigger one (i.e 15 days).
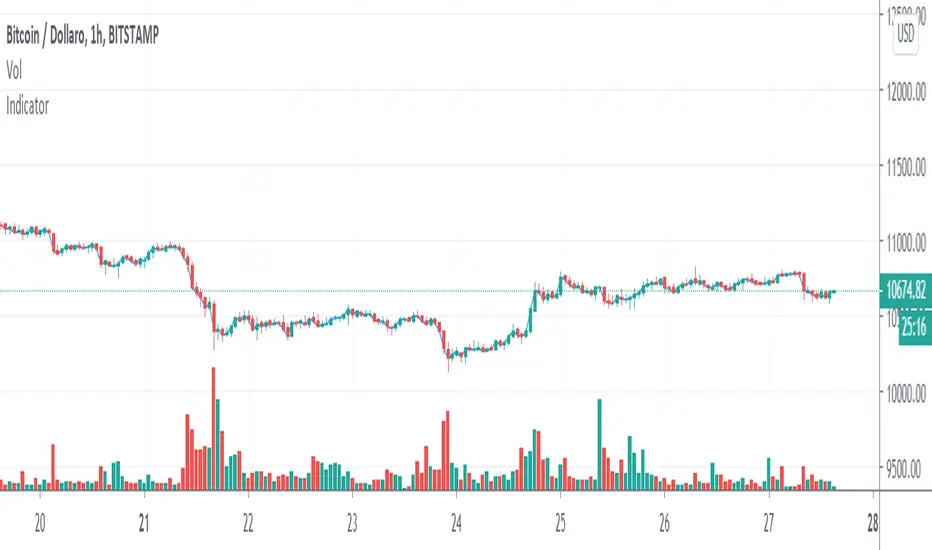
In this example, we trade BTCUSD on the 15 days cycle, so 15 days on the graph is composed of 360 candles. Our bigger cycle (Cycle 4) take 360 as period. For simplicity, "Cycle 3 to 1" take each time half of the period so: Cycle 3 -> 180, Cycle 2-> 90, Cycle 1 (smaller) -> 45.
3) Trend. 0 to a rectangle trend, -1 for bearish trend and 1 for a bullish trend .
4) Trend strength. From 0 to 2, step 0.1
This parameter expresses the strength of the trend. In a bullish market (Trend set to 1) you can set Trend strength from 0 to 2 to allow the indicator to follow the current market trend
Note:
This indicator must be put in a separate Y axis so it can overaly the graph.
The "Gann Cycle Indicator" helps you analyze market cycles, from the smaller ones to the bigger ones. It requires you to know how Gann used market cycles to trade efficently. It helps predict where to expect a minum or a maximum and where to expect the start of a new cycle. It works with any market and can be set up as you prefer. It takes some inputs to work properly:
1) Starting X: this is the offset on the X axis where all the cycles start from. Once you applied this indicator on your graph, you must adjust the starting position to match the start of the cycle you found on the graph.
2) Cycles (1 to 4). These are the period, expressed in candles number, of each cycles. "Cycle 1" (i.e 3,25 days) should be the smaller of the 4 while "Cycle 4" the bigger one (i.e 15 days).
In this example, we trade BTCUSD on the 15 days cycle, so 15 days on the graph is composed of 360 candles. Our bigger cycle (Cycle 4) take 360 as period. For simplicity, "Cycle 3 to 1" take each time half of the period so: Cycle 3 -> 180, Cycle 2-> 90, Cycle 1 (smaller) -> 45.
3) Trend. 0 to a rectangle trend, -1 for bearish trend and 1 for a bullish trend .
4) Trend strength. From 0 to 2, step 0.1
This parameter expresses the strength of the trend. In a bullish market (Trend set to 1) you can set Trend strength from 0 to 2 to allow the indicator to follow the current market trend
Note:
This indicator must be put in a separate Y axis so it can overaly the graph.
Informacje o Wersji
Version "Beta 1.0.0"The "Cycle Indicator" helps you analyze market cycles, from the smaller ones to the bigger ones. It requires you to know how market cycles work,to trade efficently. It helps predict where to expect a minum or a maximum and where to expect the start of a new cycle. It works with any market and can be set up as you prefer. It takes some inputs to work properly:
1) Starting X: this is the offset on the X axis where all the cycles start from. Once you applied this indicator on your graph, you must adjust the starting position to match the start of the cycle you found on the graph.
2) Cycles (1 to 4). These are the period, expressed in candles number, of each cycles. "Cycle 1" (i.e 3,25 days) should be the smaller of the 4 while "Cycle 4" the bigger one (i.e 15 days).
In this example, we trade BTCUSD on the 15 days cycle, so 15 days on the graph is composed of 360 candles. Our bigger cycle (Cycle 4) take 360 as period. For simplicity, "Cycle 3 to 1" take each time half of the period so: Cycle 3 -> 180, Cycle 2-> 90, Cycle 1 (smaller) -> 45.
3) Trend. 0 to a rectangle trend, -1 for bearish trend and 1 for a bullish trend .
4) Trend strength. From 0 to 2, step 0.1
This parameter expresses the strength of the trend. In a bullish market (Trend set to 1) you can set Trend strength from 0 to 2 to allow the indicator to follow the current market trend
Note:
This indicator must be put in a separate Y axis so it can overaly the graph.
Informacje o Wersji
-Skrypt chroniony
Ten skrypt został opublikowany jako zamknięty kod źródłowy. Można z tego korzystać swobodnie i bez żadnych ograniczeń — więcej informacji znajduje się tutaj.
Wyłączenie odpowiedzialności
Informacje i publikacje nie stanowią i nie powinny być traktowane jako porady finansowe, inwestycyjne, tradingowe ani jakiekolwiek inne rekomendacje dostarczane lub zatwierdzone przez TradingView. Więcej informacji znajduje się w Warunkach użytkowania.
Skrypt chroniony
Ten skrypt został opublikowany jako zamknięty kod źródłowy. Można z tego korzystać swobodnie i bez żadnych ograniczeń — więcej informacji znajduje się tutaj.
Wyłączenie odpowiedzialności
Informacje i publikacje nie stanowią i nie powinny być traktowane jako porady finansowe, inwestycyjne, tradingowe ani jakiekolwiek inne rekomendacje dostarczane lub zatwierdzone przez TradingView. Więcej informacji znajduje się w Warunkach użytkowania.