PROTECTED SOURCE SCRIPT
Zaktualizowano Ollie_allcaps Momentum Indicator
Momentum is created when a security makes a large move on higher-than-average volume. Momentum shows the rate of change in price movement over a period of time to help investors determine the strength of a trend.
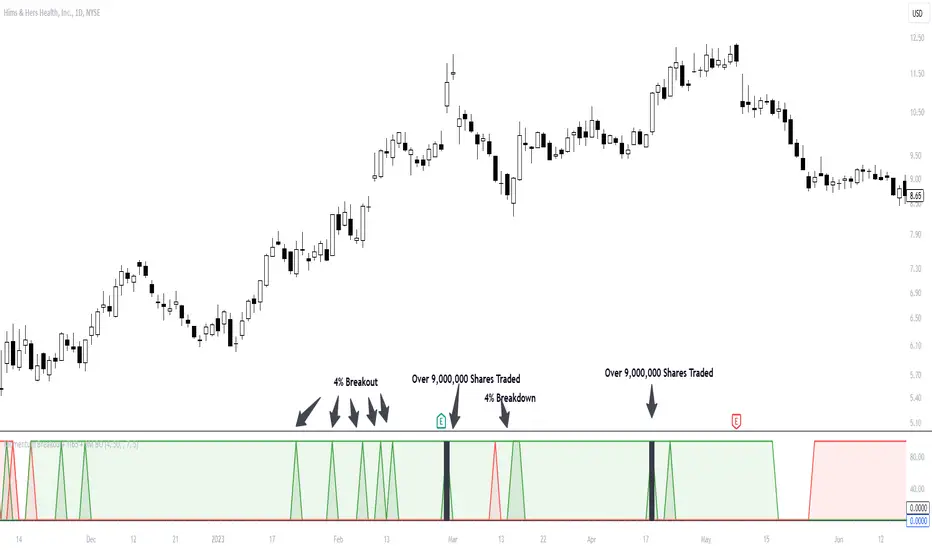
This indicator will create a green spike once price advances 4% and is trading above the 50-day average trading volume. However, if the stock begins to breakdown (-4% or greater on above average volume), a red spike will be created.
These green and red spikes represent a change in momentum that occurs in the selected security.
This indictor should be used in 2 ways:
1: What are the charecteristics of this stock? Does it breakdown shortly after a momentum spike? or does the security trend in orderly manner after a momentum spike?
2: Investers should use this indicator to determine the strength of a momentum breakout in real time. Has the stock made a large move, but with no significant volume?
Customization:
The Percentage move, and average daily volume can be changed as well as colors.
Alerts:
If you wish to set an alert, this indicator allows you to create an alert when the selected stock meets your desired criteria.
Informacje o Wersji
The recent addition to this momentum Indicator is the addition of the Trend Intensity 65 (TI65). TI65 measure how Intense the trend is by signaling when the 7-period moving average is greater than 5% above the 65-period moving average. This information is important when determining not only if the stock is in an uptrend, but how INTENSE the trend is.
Using both the 4% breakout signal AND the TI65 together, traders will have a very clear picture of a stock making a strong momentum move. Traders can use this information to find low risk opportunities during the strong trend. Finally, when a stock is in an intense uptrend AND breaking out on high volume, traders will have an edge using this indicator.
Informacje o Wersji
Popularized by Stockbee, the 9 million breakout can be used by momentum traders who are seeking to improve their breakout trading. When a stock begins to trade 9 million shares while breaking out, this can signal serious accumulation.Traders can quickly identify if a breakout is high quality or not by the number of shares being traded. This additional feature in this indicator plots a black bar to help traders visually see when 4% breakouts/downs occur and when a 9 million share breakout is underway.
This indicator is the full package for traders who want to quickly read price action and improve their momentum burst trading.
Informacje o Wersji
Fixed a bug within the codeInformacje o Wersji
Fixed chart and Indicator name Informacje o Wersji
The 9 million breakout is now behind the 4% breakout/ down. This is a simple adjustment for more appealing visuals. Skrypt chroniony
Ten skrypt został opublikowany jako zamknięty kod źródłowy. Można z tego korzystać swobodnie i bez żadnych ograniczeń — więcej informacji znajduje się tutaj.
Wyłączenie odpowiedzialności
Informacje i publikacje nie stanowią i nie powinny być traktowane jako porady finansowe, inwestycyjne, tradingowe ani jakiekolwiek inne rekomendacje dostarczane lub zatwierdzone przez TradingView. Więcej informacji znajduje się w Warunkach użytkowania.
Skrypt chroniony
Ten skrypt został opublikowany jako zamknięty kod źródłowy. Można z tego korzystać swobodnie i bez żadnych ograniczeń — więcej informacji znajduje się tutaj.
Wyłączenie odpowiedzialności
Informacje i publikacje nie stanowią i nie powinny być traktowane jako porady finansowe, inwestycyjne, tradingowe ani jakiekolwiek inne rekomendacje dostarczane lub zatwierdzone przez TradingView. Więcej informacji znajduje się w Warunkach użytkowania.