Seasonality
Seasonality in trading refers to recurring market patterns that tend to happen around the same time each year, month, or even week. These patterns are based on historical tendencies, for example, certain stocks or indices often rise or fall during specific periods due to consistent economic, institutional, or behavioral factors.
A simple example:
The S&P 500 often performs stronger in the last quarter of the year (“Santa Rally”).
Crude oil prices tend to rise during summer months when demand for fuel increases.
Agricultural commodities follow planting and harvest cycles.
By analyzing these seasonal trends, traders can gain an additional layer of probability in their decision-making. It doesn’t replace technical or fundamental analysis, but it complements them by showing when a market historically tends to move in a certain direction.
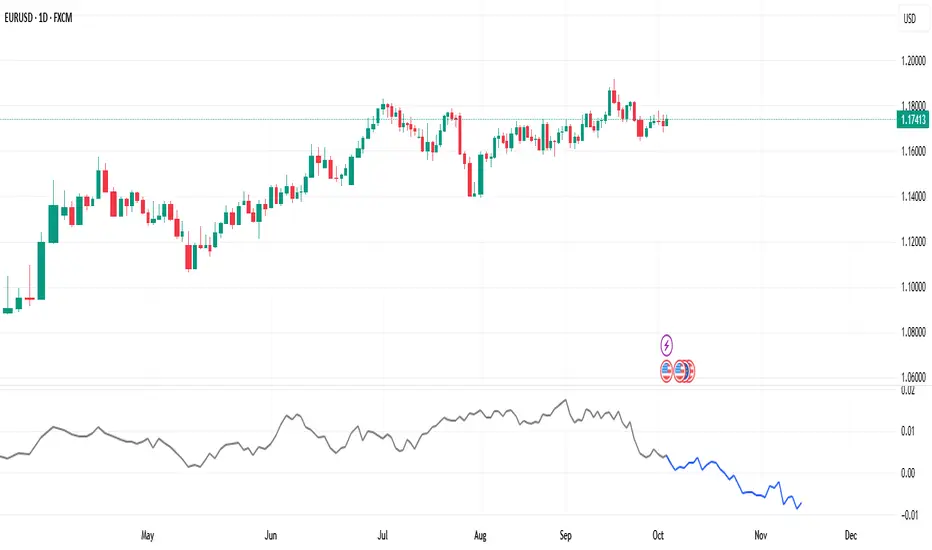
That’s why a seasonality indicator can be extremely useful:
It visualizes past performance patterns directly on your chart.
It helps identify periods of high or low probability for bullish or bearish moves.
It allows traders to align trades with statistical tendencies, not just current price action.
You can also customize the lookback period, for example, view seasonal patterns from the last 5, 10, 15, or 20 years, depending on how much historical data you want to include.
In short, a good seasonality indicator doesn’t predict the future, it highlights what markets tend to do, helping traders act with more context and confidence.
Skrypt tylko na zaproszenie
Tylko użytkownicy zatwierdzeni przez autora mogą uzyskać dostęp do tego skryptu. Musisz złożyć prośbę i uzyskać zgodę na jego użycie. Zazwyczaj jest ona udzielana po dokonaniu płatności. Aby uzyskać więcej informacji, postępuj zgodnie z instrukcjami autora poniżej lub skontaktuj się bezpośrednio z SDprof.
TradingView NIE zaleca płacenia za skrypt ani jego używania, jeśli nie masz pełnego zaufania do jego autora i nie rozumiesz, jak działa. Możesz także znaleźć darmowe, open-source'owe alternatywy w naszej sekcji skryptów społecznościowych.
Instrukcje autora
Wyłączenie odpowiedzialności
Skrypt tylko na zaproszenie
Tylko użytkownicy zatwierdzeni przez autora mogą uzyskać dostęp do tego skryptu. Musisz złożyć prośbę i uzyskać zgodę na jego użycie. Zazwyczaj jest ona udzielana po dokonaniu płatności. Aby uzyskać więcej informacji, postępuj zgodnie z instrukcjami autora poniżej lub skontaktuj się bezpośrednio z SDprof.
TradingView NIE zaleca płacenia za skrypt ani jego używania, jeśli nie masz pełnego zaufania do jego autora i nie rozumiesz, jak działa. Możesz także znaleźć darmowe, open-source'owe alternatywy w naszej sekcji skryptów społecznościowych.