PROTECTED SOURCE SCRIPT
[MattLet] RSI Andrew Cardwell
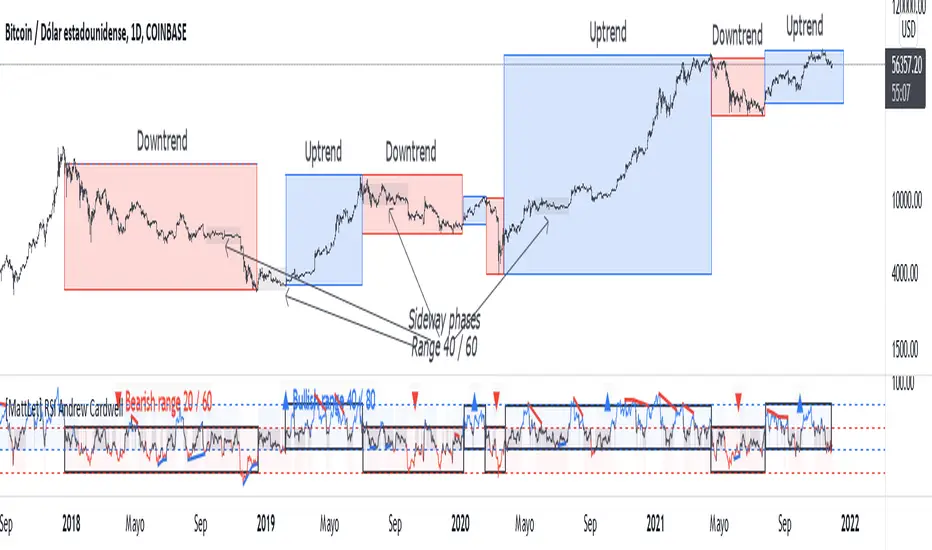
Andrew Cardwell RSI helps to identify the range shift, which states whether the market is in bullish or bearish phase.
When RSI oscillates in the range of 40 to 80 we can said that we are in a uptrend (blue background color on RSI), however when RSI oscillates in the range of 20 to 60 we are in a downtrend (red background color on RSI).
Finally if the RSI oscillates between 40 to 60, it is considerated a sideway phase (gray background color on RSI).
Keep in mind that within an uptrend or downtrend there may be a lateral phases and then continue in the trend (gray boxes on the BTC/USD price xample)
I added bearish and bullish divergences (hidden divergences too) to help users to indentify possible trending endings.
Note: I still working improving how the indicator display the areas, so I will letting you know when I finish that. Anyway, you can use it normally right now.
Good Luck!
Skrypt chroniony
Ten skrypt został opublikowany jako zamknięty kod źródłowy. Można z tego korzystać swobodnie i bez żadnych ograniczeń — więcej informacji znajduje się tutaj.
Wyłączenie odpowiedzialności
Informacje i publikacje nie stanowią i nie powinny być traktowane jako porady finansowe, inwestycyjne, tradingowe ani jakiekolwiek inne rekomendacje dostarczane lub zatwierdzone przez TradingView. Więcej informacji znajduje się w Warunkach użytkowania.