Institutional Signal Engine (ISE)
ISE is a multi-layer institutional trading system that combines trend, volatility, volume, and multi-timeframe logic into one advanced framework.
It identifies high-probability reversals, institutional accumulation/distribution phases, and Smart Buy/Sell setups confirmed by higher-timeframe filters.
The indicator integrates:
TSI–RSI–ATR dashboard (weekly basis)
Monthly trend filter (long-term direction)
A/D Line divergences and volume spikes on compression
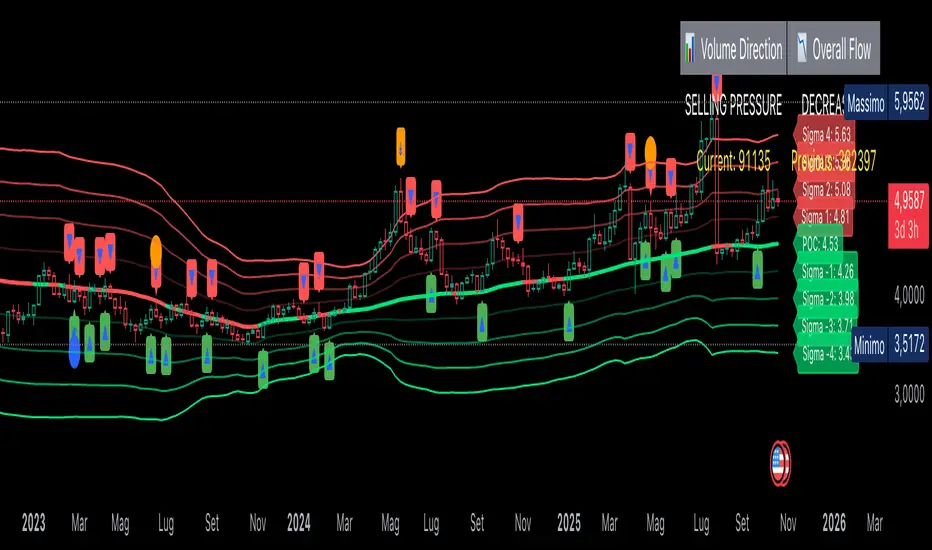
Dynamic Sigma ±1…±4 volume bands (VWMA-based)
Smart visual signals, alerts, and real-time data tables
⚙️ Core Logic – Step by Step
1️⃣ Multi-Timeframe Engine
Calculates TSI, RSI, and ATR on the weekly timeframe to filter out short-term noise.
Uses a 10-period SMA on monthly close as long-term filter:
Above = monthly bullish bias
Below = monthly bearish bias
2️⃣ Weekly Trend Change Detection
A 10-bar SMA defines the weekly trend:
Green arrow “▲” = Bullish reversal
Red arrow “▼” = Bearish reversal
Automatic alerts are triggered when a reversal occurs.
3️⃣ Directional Score (0–100%)
A 4-factor composite score measures directional strength:
Component Weight Effect
TSI trend direction 25% Momentum bias
RSI above/below 50 25% Market strength
ATR above volatility threshold 25% Volatility confirmation
Monthly trend alignment 25% Institutional filter
Score ≥ 75% = strong institutional confirmation
Combined with monthly bias, this defines Smart Entry Zones
4️⃣ Institutional Module
🔸 A/D Line Divergences
Detects when volume flow diverges from price:
Price down + A/D up → bullish divergence (accumulation)
Price up + A/D down → bearish divergence (distribution)
🔸 Volume Spikes on Compression
Flags breakouts when price range contracts but volume surges sharply.
Indicates institutional activity and momentum expansion.
🔸 Smart Buy / Smart Sell Conditions
Smart signals appear only when all conditions align:
Divergence or volume spike,
Score ≥ 75%,
Monthly trend confirmation,
(Optional) Weekly trend reversal if enabled.
✅ Smart Buy (C) → Green triangle below bar
✅ Smart Sell (V) → Red triangle above bar
5️⃣ Advanced Visual Signals
Symbol Meaning Interpretation
▲ / ▼ Weekly trend reversal Direction change
🟢 C / 🔴 V Smart Buy / Smart Sell Institutional setup
🔵 / 🟠 Circles Ideal confirmed trades Retrospective validation
💠 Fuchsia Diamond Probable low Anticipated bullish reversal
↟ / ↡ RSI/SMA extreme cross Visual early warning
6️⃣ Sigma ±1..±4 Volume Bands (VWMA-70)
Based on Volume Weighted Moving Average (VWMA 70), not Bollinger.
Defines 4 upper and 4 lower Sigma levels relative to the current equilibrium (POC).
Acts as a probabilistic map of volume balance zones.
Labels display real-time price values for each band (auto-updated each bar).
7️⃣ Real-Time Information Tables
📋 Oscillator Table (Right side)
Displays the status of three oscillators:
Indicator Signal
Stochastic BUY / SELL / NEUTRAL
Fisher Transform BUY / SELL / NEUTRAL
Williams %R BUY / SELL / NEUTRAL
Colors: 🟢 = Buy, 🔴 = Sell, 🟠 = Neutral
📊 Volume Table (Top right)
Shows:
Volume Direction: buying / selling / neutral
Trend vs previous bar: increasing / decreasing / stable
Current vs previous volume values
🧠 How to Use and Interpret
🔹 Step 1 – Identify Context
Use the monthly filter and weekly arrows to determine the institutional direction.
📈 Both up = bullish environment
📉 Both down = bearish environment
Mixed = neutral / uncertain
🔹 Step 2 – Wait for Alignment
Trade only when Smart Signals appear in the same direction as the higher timeframe trend.
Green “C” = buy signal within bullish structure
Red “V” = sell signal within bearish structure
🔹 Step 3 – Confirm with Volumes and Sigma Bands
If price is near Sigma −2 / −3, expect potential rebound (buy zones).
If price is near Sigma +2 / +3, expect exhaustion (sell zones).
Strong volume spike + Smart signal = institutional confirmation
🔹 Step 4 – Manage Trades
Use weekly ATR or Sigma ±2 as volatility-based stop levels.
Exit on opposite Smart signal or trend reversal arrow.
📈 Interpretation Summary
Condition Meaning Bias
Green ▲ + Smart Buy + Score ≥75 Confirmed bullish reversal Long setup
Red ▼ + Smart Sell + Score ≥75 Confirmed bearish reversal Short setup
Fuchsia Diamond ⚡ Probable local bottom Early long opportunity
Narrow Sigma bands Compression → Pre-breakout Wait for expansion
Wide Sigma bands High volatility / exhaustion Avoid new entries
⚡ Summary
Aspect Description
Name Lanfranco Bilotti – Institutional Trading + Alert
Structure Multi-timeframe, multi-indicator system
Core Modules TSI, RSI, ATR, A/D Divergence, Volume Spike, Sigma Bands
Signals Smart Buy/Sell, Probable Low, Trend Arrows
Alerts Automatic weekly reversal alerts
Filters Weekly and monthly trend filters
Output Visual dashboard + dual data tables
Best timeframe Weekly or Daily (for institutional flow)
Main goal Detect institutional trend phases and confirm high-probability entries
💼 Trading Instructions (Usage Guide) !!!!
🔹 Step-by-Step Usage
1️⃣ Choose timeframe
Recommended use on Daily or Weekly charts.
Institutional alignment works best when Weekly = Monthly trend.
2️⃣ Identify market context
📈 Bullish environment: Monthly filter = UP and weekly arrow ▲
📉 Bearish environment: Monthly filter = DOWN and weekly arrow ▼
3️⃣ Wait for confirmation
Smart BUY (C) → appears only when volume, trend, and oscillators align.
Smart SELL (V) → confirmed institutional distribution setup.
4️⃣ Entry rules (example)
Long entry: when Smart BUY (C) appears and the current price is near Sigma −1 or −2.
Short entry: when Smart SELL (V) appears and the price is near Sigma +1 or +2.
5️⃣ Stop loss suggestion (statistical)
Use weekly ATR or next Sigma band as volatility-based stop.
Example: if entry at Sigma −1 → stop below Sigma −2.
6️⃣ Exit strategy
Exit when the opposite Smart Signal appears (C → V or V → C).
Or when a new weekly reversal arrow ▲ / ▼ is printed.
🔹 Interpretation Summary
Symbol Meaning Action Bias
▲ / ▼ Weekly trend reversal Confirms long / short bias
🟢 C Smart Buy Long entry zone
🔴 V Smart Sell Short entry zone
💠 Fuchsia Diamond Probable low Early long opportunity
↟ / ↡ RSI/SMA extreme Momentum exhaustion zone
=================================================
Trade only in the direction of the higher timeframe trend.
Smart BUY (C) → enter long when price is near Sigma −1 / −2 and monthly trend = UP.
Smart SELL (V) → enter short when price is near Sigma +1 / +2 and monthly trend = DOWN.
Exit on the opposite Smart signal or when a new weekly arrow ▲ / ▼ appears.
Use the weekly ATR or next Sigma band for stop-loss placement.
Always confirm signals at candle close.
Skrypt tylko na zaproszenie
Tylko użytkownicy zatwierdzeni przez autora mogą uzyskać dostęp do tego skryptu. Musisz złożyć prośbę i uzyskać zgodę na jego użycie. Zazwyczaj jest ona udzielana po dokonaniu płatności. Aby uzyskać więcej informacji, postępuj zgodnie z instrukcjami autora poniżej lub skontaktuj się bezpośrednio z LanfryBil.
TradingView NIE zaleca płacenia za skrypt ani jego używania, jeśli nie masz pełnego zaufania do jego autora i nie rozumiesz, jak działa. Możesz także znaleźć darmowe, open-source'owe alternatywy w naszej sekcji skryptów społecznościowych.
Instrukcje autora
Wyłączenie odpowiedzialności
Skrypt tylko na zaproszenie
Tylko użytkownicy zatwierdzeni przez autora mogą uzyskać dostęp do tego skryptu. Musisz złożyć prośbę i uzyskać zgodę na jego użycie. Zazwyczaj jest ona udzielana po dokonaniu płatności. Aby uzyskać więcej informacji, postępuj zgodnie z instrukcjami autora poniżej lub skontaktuj się bezpośrednio z LanfryBil.
TradingView NIE zaleca płacenia za skrypt ani jego używania, jeśli nie masz pełnego zaufania do jego autora i nie rozumiesz, jak działa. Możesz także znaleźć darmowe, open-source'owe alternatywy w naszej sekcji skryptów społecznościowych.