PROTECTED SOURCE SCRIPT
Free Sleepy Wallets ≥0.1 BTC – 6-Month Dormancy
What This Indicator Does
It measures how many Bitcoin addresses holding 0.5 BTC or more have been completely untouched for at least 6 months (≥ 180 days) — using official Glassnode on-chain data.
This reveals deep conviction among mid-tier holders:
Are long-term HODLers still in control — or are they finally selling?
Core Concept: 180-Day Dormancy + Bucket Aggregation
This indicator combines two precise on-chain signals:
≥ 0.5 BTC Total Supply in Addresses
Built by aggregating two Glassnode rich-list buckets:
0.1 ≤ balance < 1 BTC
≥ 1 BTC
Result: Exact count of all addresses ≥ 0.5 BTC (no gaps, no overlap)
6-Month Dormant Addresses (All Balances)
From GLASSNODE:XTVCBTC_ADDRESSES_GREATER_THAN_180_DAYS
Counts every address that has not transacted in ≥ 180 days
Sleepy ≥ 0.5 BTC = (Share of 6-month dormant addresses) × (Total ≥ 0.5 BTC)
This gives the estimated number of ≥ 0.5 BTC wallets that are truly long-term dormant.
Why 6-Month Dormancy Matters
7-day activity shows short-term noise.
180-day inactivity reveals real HODLing behavior — coins locked away during entire market cycles.
Historically, rising 6-month dormancy in ≥ 0.5 BTC wallets precedes major bull runs as supply dries up.
Falling dormancy often signals capitulation or profit-taking by long-term holders.
How It Works (Step-by-Step)
Fetches daily data from three Glassnode symbols:
Two rich-list buckets → Total ≥ 0.5 BTC
One dormancy metric → All addresses inactive ≥ 180 days
Calculates the proportion of dormant addresses in the entire network
Applies that ratio to the ≥ 0.5 BTC total → Sleepy ≥ 0.5 (6M)
Smooths the result with a 21-day simple moving average (SMA) to reveal trends
Computes Sleepy Ratio % = (Sleepy 6M ÷ Total ≥ 0.5 BTC) × 100
Fallback mode uses price/volume scaling when Glassnode data is unavailable (free plan compatible)
How to Use It
Signal
Interpretation
Suggested Action
Sleepy Ratio > 68% and rising
Long-term holders refusing to sell
Strong accumulation — buy/hold
Smooth Sleepy trending up
6-month dormancy growing over 21 days
Bullish supply shock forming
Sleepy Ratio < 60% and falling
Long-term coins re-entering circulation
Caution — possible distribution
Smooth Sleepy dropping fast
HODLers breaking after 6+ months
Bearish warning — consider exits
Use on Daily (D) or Weekly (W) charts for clean, actionable signals.
What Makes This Indicator Original
First script to combine Glassnode’s 180-day dormancy metric with custom ≥ 0.5 BTC aggregation
No fake thresholds — uses true 6-month inactivity, not short-term activity
Proportional scaling ensures the ≥ 0.5 BTC dormancy estimate is grounded in real network behavior
Dual output: raw 6-month sleepy count + 21-day SMA for noise reduction and trend clarity
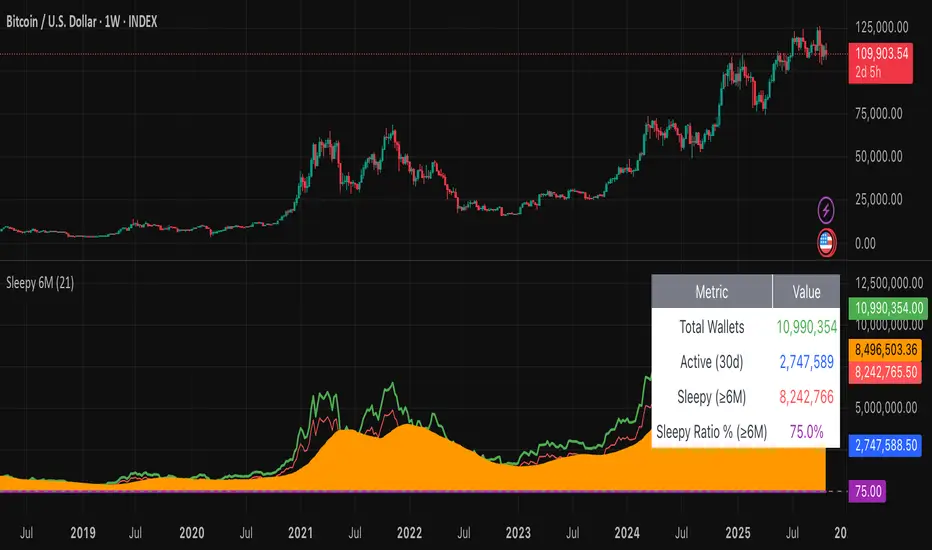
Live info table shows exact values and data source on every bar
It measures how many Bitcoin addresses holding 0.5 BTC or more have been completely untouched for at least 6 months (≥ 180 days) — using official Glassnode on-chain data.
This reveals deep conviction among mid-tier holders:
Are long-term HODLers still in control — or are they finally selling?
Core Concept: 180-Day Dormancy + Bucket Aggregation
This indicator combines two precise on-chain signals:
≥ 0.5 BTC Total Supply in Addresses
Built by aggregating two Glassnode rich-list buckets:
0.1 ≤ balance < 1 BTC
≥ 1 BTC
Result: Exact count of all addresses ≥ 0.5 BTC (no gaps, no overlap)
6-Month Dormant Addresses (All Balances)
From GLASSNODE:XTVCBTC_ADDRESSES_GREATER_THAN_180_DAYS
Counts every address that has not transacted in ≥ 180 days
Sleepy ≥ 0.5 BTC = (Share of 6-month dormant addresses) × (Total ≥ 0.5 BTC)
This gives the estimated number of ≥ 0.5 BTC wallets that are truly long-term dormant.
Why 6-Month Dormancy Matters
7-day activity shows short-term noise.
180-day inactivity reveals real HODLing behavior — coins locked away during entire market cycles.
Historically, rising 6-month dormancy in ≥ 0.5 BTC wallets precedes major bull runs as supply dries up.
Falling dormancy often signals capitulation or profit-taking by long-term holders.
How It Works (Step-by-Step)
Fetches daily data from three Glassnode symbols:
Two rich-list buckets → Total ≥ 0.5 BTC
One dormancy metric → All addresses inactive ≥ 180 days
Calculates the proportion of dormant addresses in the entire network
Applies that ratio to the ≥ 0.5 BTC total → Sleepy ≥ 0.5 (6M)
Smooths the result with a 21-day simple moving average (SMA) to reveal trends
Computes Sleepy Ratio % = (Sleepy 6M ÷ Total ≥ 0.5 BTC) × 100
Fallback mode uses price/volume scaling when Glassnode data is unavailable (free plan compatible)
How to Use It
Signal
Interpretation
Suggested Action
Sleepy Ratio > 68% and rising
Long-term holders refusing to sell
Strong accumulation — buy/hold
Smooth Sleepy trending up
6-month dormancy growing over 21 days
Bullish supply shock forming
Sleepy Ratio < 60% and falling
Long-term coins re-entering circulation
Caution — possible distribution
Smooth Sleepy dropping fast
HODLers breaking after 6+ months
Bearish warning — consider exits
Use on Daily (D) or Weekly (W) charts for clean, actionable signals.
What Makes This Indicator Original
First script to combine Glassnode’s 180-day dormancy metric with custom ≥ 0.5 BTC aggregation
No fake thresholds — uses true 6-month inactivity, not short-term activity
Proportional scaling ensures the ≥ 0.5 BTC dormancy estimate is grounded in real network behavior
Dual output: raw 6-month sleepy count + 21-day SMA for noise reduction and trend clarity
Live info table shows exact values and data source on every bar
Skrypt chroniony
Ten skrypt został opublikowany jako zamknięty kod źródłowy. Możesz jednak używać go swobodnie i bez żadnych ograniczeń – więcej informacji tutaj.
Wyłączenie odpowiedzialności
Informacje i publikacje przygotowane przez TradingView lub jego użytkowników, prezentowane na tej stronie, nie stanowią rekomendacji ani porad handlowych, inwestycyjnych i finansowych i nie powinny być w ten sposób traktowane ani wykorzystywane. Więcej informacji na ten temat znajdziesz w naszym Regulaminie.