PROTECTED SOURCE SCRIPT
[VBose] Bank Nifty Volume With Accumulation/Distribution

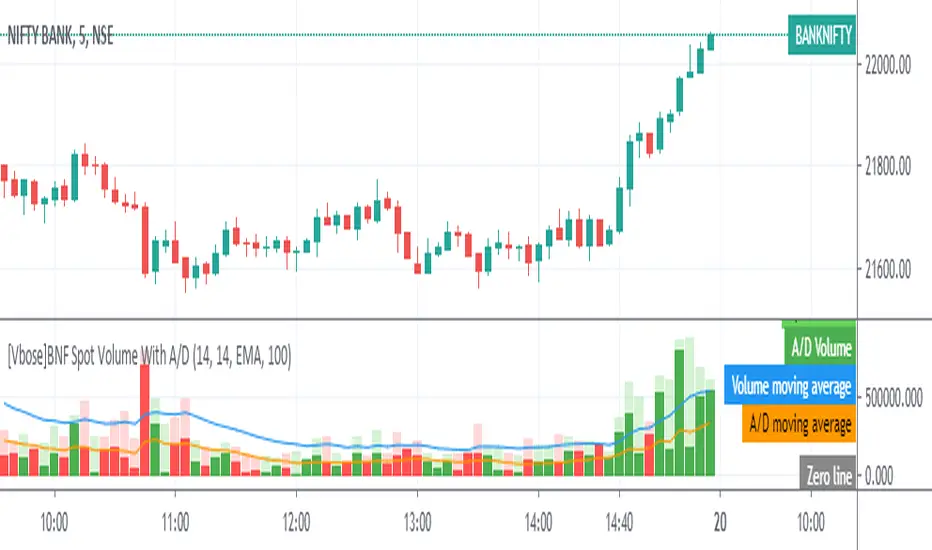
Bank Nifty Volume With Accumulation/Distribution Indicator shows Weighted Spot volume bars and the accumulated/distributed (A/D) portion of them. It calculates candle body to candle height ratio and multiplies it by Spot volume: Spot volume*(close-open)/(high-low)
The Spot Volume is calculated by the weighted sum (Composite method) of deriving stock volume from underlying 12 stocks in the Bank Nifty Index.
This Indicator has ability to multiply The Volume With Price and Take the Output of Volume or A/D to be fed as source in other indicators.
Light Green Color Shows Total Bull Volume [close]>[previous close] With Dark Green Color as Accumulation
Light Red Color Shows Total Bear Volume[close]<[previous close] With Dark Red Color as Distribution
Moving Average for Volume and A/D Line can be added with custom Moving Average Settings
Note:Trading view still does not provide Volume in Bank Nifty Index and this indicator calculates Spot Volume which is different than Futures Volume of Bank Nifty.
Skrypt chroniony
Ten skrypt został opublikowany jako zamknięty kod źródłowy. Można z tego korzystać swobodnie i bez żadnych ograniczeń — więcej informacji znajduje się tutaj.
Wyłączenie odpowiedzialności
Informacje i publikacje nie stanowią i nie powinny być traktowane jako porady finansowe, inwestycyjne, tradingowe ani jakiekolwiek inne rekomendacje dostarczane lub zatwierdzone przez TradingView. Więcej informacji znajduje się w Warunkach użytkowania.