PROTECTED SOURCE SCRIPT
NK-Macd + Rsi3
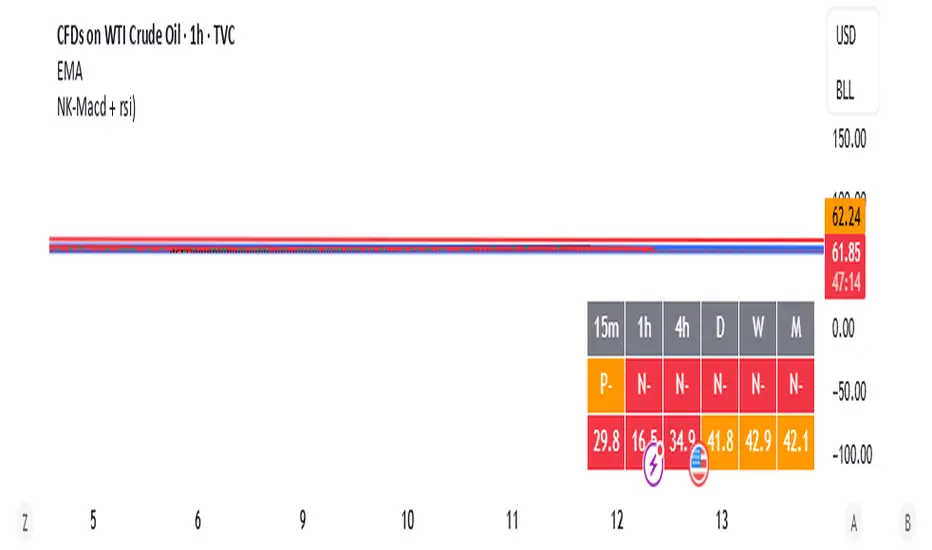
Here in one table you can see the MACD of the different time frame that what is the status of the MACD, is it above zero line or below zero line.
Second you will see in table that RSI number of all time frame, so here we dont need to go and check RSI by switching the chart and time frame.
at one place you will see both RSI and MACD, and by seeing the number you can check when the price in oversold zone and when it will in overbought also you can see the when the price in momentum and when not.
Example :- let assume RSI table showing above 40 in 1 hr and 67 in daily that means RSI is in swing momentum in hrly but momentum in daily.
Skrypt chroniony
Ten skrypt został opublikowany jako zamknięty kod źródłowy. Można z tego korzystać swobodnie i bez żadnych ograniczeń — więcej informacji znajduje się tutaj.
Wyłączenie odpowiedzialności
Informacje i publikacje nie stanowią i nie powinny być traktowane jako porady finansowe, inwestycyjne, tradingowe ani jakiekolwiek inne rekomendacje dostarczane lub zatwierdzone przez TradingView. Więcej informacji znajduje się w Warunkach użytkowania.