PROTECTED SOURCE SCRIPT
atrATR
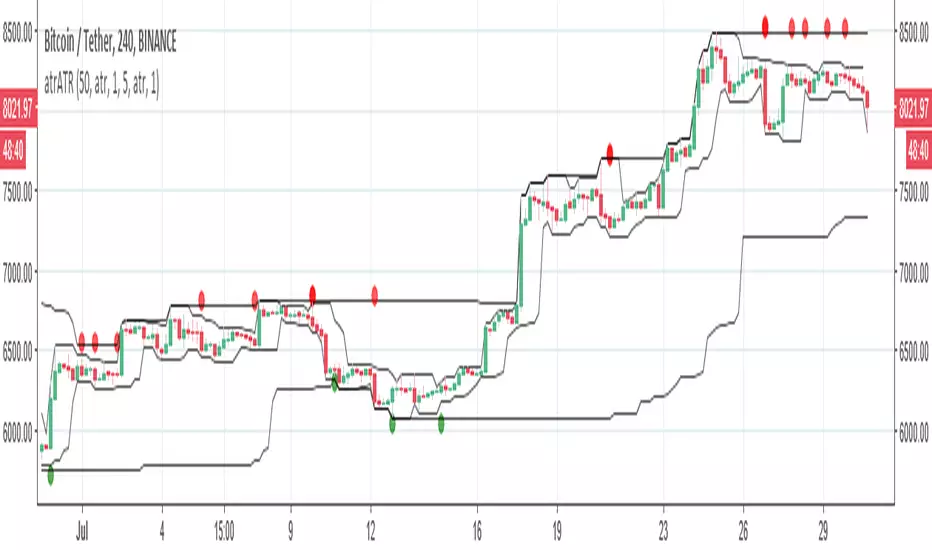
so this easy to see indicator based on ATR and donochian channel
there is fast and there is slow channels . when they are kissing each other then either in the low point or high point is change of trend. for example: the price went to high point and the fast channel is departing down from the slow this is time to sell.
the opposite when the fast channel departing up from the slow channel
it the same mechanism of the linear regression just more accurate.
the circles are just point where ATR think it time to buy or sell. but this is easy way to think on trends and to figure out if you going short or long
Skrypt chroniony
Ten skrypt został opublikowany jako zamknięty kod źródłowy. Można z tego korzystać swobodnie i bez żadnych ograniczeń — więcej informacji znajduje się tutaj.
Wyłączenie odpowiedzialności
Informacje i publikacje nie stanowią i nie powinny być traktowane jako porady finansowe, inwestycyjne, tradingowe ani jakiekolwiek inne rekomendacje dostarczane lub zatwierdzone przez TradingView. Więcej informacji znajduje się w Warunkach użytkowania.