PROTECTED SOURCE SCRIPT
Zaktualizowano Ghost Trend

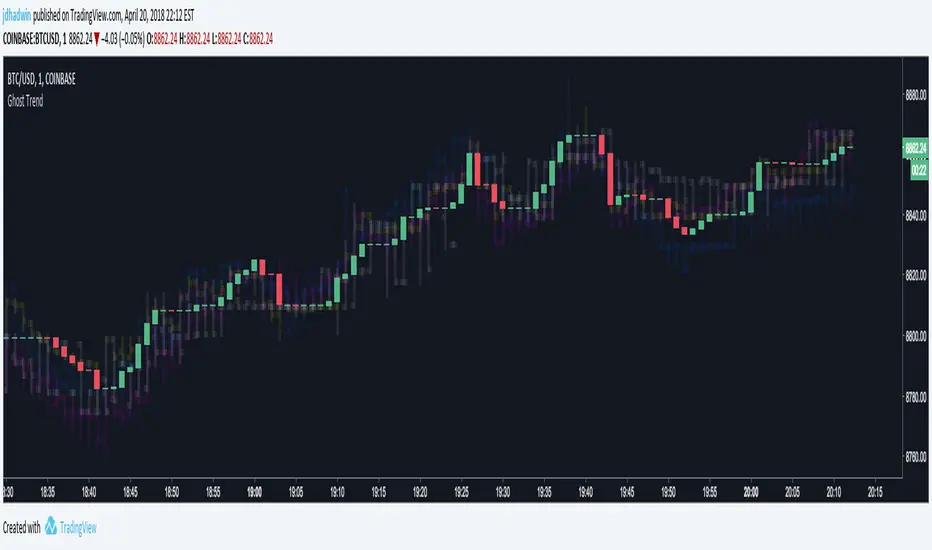
Use ghosted charts from multiple exchanges to visualize global market trends for your trading pair BEFORE the trend comes to your exchange. Use Ghost Averaging to find what Bitcoin is ACTUALLY doing across up to four exchanges, by averaging all four exchanges into a single ghost. As for the name, Ghost Trend just sounded way cooler than Arbitrage Helper!

Hone your skills and you may even find yourself able to avoid crashes moments BEFORE they happen, or able buy right BEFORE a take-off. Ghosts sometimes show moves earlier than the exchange you're using. But be careful, sometimes ghosts are nasty little deceivers 8o

Instructions:

Lots of fun to be had on the 1 minute chart, but it's especially useful to use Ghost Averaging with Open and Close unchecked and High and Low checked, when on greater resolution charts. ;) Happy arbitraging!
If you'd like to incorporate Ghost Trend into your script, you know where to find me.
~jdhadwin
Hone your skills and you may even find yourself able to avoid crashes moments BEFORE they happen, or able buy right BEFORE a take-off. Ghosts sometimes show moves earlier than the exchange you're using. But be careful, sometimes ghosts are nasty little deceivers 8o
Instructions:
- First time ghosting? Start out with a 1 minute Bitcoin chart on Coinbase (
BTCUSD), then check out the Ghost Trend settings.
- Start small, pick just one alternate exchange (say
Bitfinex) and play with the Ghosted Open/High/Low/Close settings. Certain combinations will display bars by default, others will display plotted lines. Make it work for you.
- Next, pick a second exchange and you'll see a second ghost. Now comes the fun part. Click "Average Ghosted Pairs". Now you're looking at the two averaged together. You can even average Coinbase back into the Ghosted Average if you want. Add up to four, and most importantly, have fun.
- DON'T FORGET TO SET THE CORRECT CHART RESOLUTION!!! Everything goes haywire if you mismatch Ghost Trend's resolution with your current chart.
Lots of fun to be had on the 1 minute chart, but it's especially useful to use Ghost Averaging with Open and Close unchecked and High and Low checked, when on greater resolution charts. ;) Happy arbitraging!
If you'd like to incorporate Ghost Trend into your script, you know where to find me.
~jdhadwin
Informacje o Wersji
Eliminates the need to select the period you are using; so no more mismatched chart resolutions. This version also slightly optimizes code for speed and efficiency. Currently testing a Ghost Volume companion indicator.Skrypt chroniony
Ten skrypt został opublikowany jako zamknięty kod źródłowy. Można z tego korzystać swobodnie i bez żadnych ograniczeń — więcej informacji znajduje się tutaj.
Wyłączenie odpowiedzialności
Informacje i publikacje nie stanowią i nie powinny być traktowane jako porady finansowe, inwestycyjne, tradingowe ani jakiekolwiek inne rekomendacje dostarczane lub zatwierdzone przez TradingView. Więcej informacji znajduje się w Warunkach użytkowania.
Skrypt chroniony
Ten skrypt został opublikowany jako zamknięty kod źródłowy. Można z tego korzystać swobodnie i bez żadnych ograniczeń — więcej informacji znajduje się tutaj.
Wyłączenie odpowiedzialności
Informacje i publikacje nie stanowią i nie powinny być traktowane jako porady finansowe, inwestycyjne, tradingowe ani jakiekolwiek inne rekomendacje dostarczane lub zatwierdzone przez TradingView. Więcej informacji znajduje się w Warunkach użytkowania.