PROTECTED SOURCE SCRIPT
Gold Total Market Cap By Wave Trader
Gold Total Market Cap (Updated 2025)
Overview
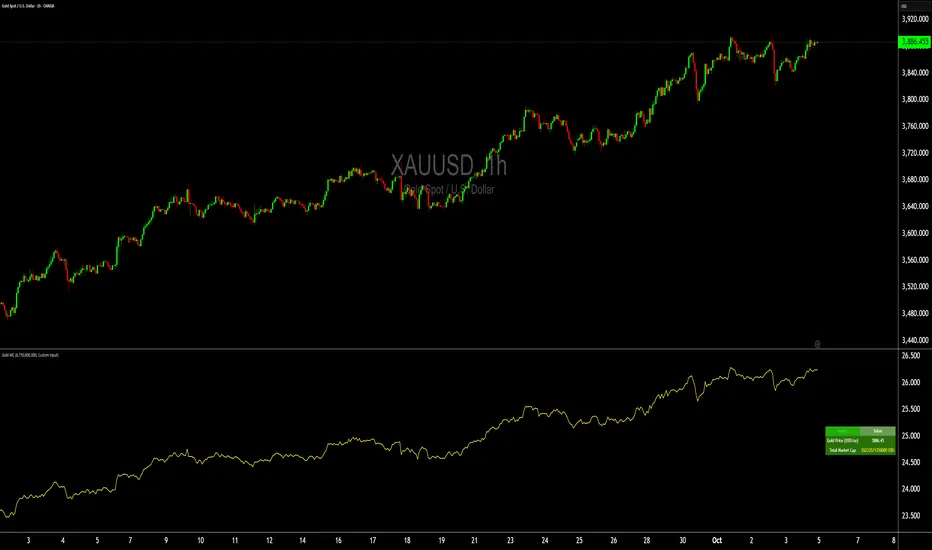
This indicator calculates and visualizes the total market capitalization of gold in real-time, based on the current XAUUSD spot price and the estimated above-ground gold supply. It transforms the raw gold price into a scaled "market cap" view (in trillions USD), helping traders contextualize gold's global value—often compared to stocks, crypto, or fiat reserves. As of October 2025, gold's cap hovers around $26–27T, underscoring its status as a premier safe-haven asset.
How It Works
Core Formula: Market Cap = Gold Price (USD/oz) × Total Supply (troy oz), scaled to trillions for chart readability.
Supply Data: Defaults to the World Gold Council (WGC) mid-2025 estimate of ~218,000 metric tonnes (~7.01B troy oz), but customizable for scenarios like historical or projected figures.
Plotted as a smooth yellow line below the price pane, mirroring gold's price movements but in cap terms.
Key Features
Dynamic Label: A real-time label on the yellow line displays the exact market cap (e.g., "26.8") for instant reference, styled like popular TradingView cap indicators.
Reference Line: Horizontal dashed line at 25T USD to highlight key thresholds (e.g., surpassing Bitcoin's cap).
Info Table: Top-right panel shows current gold price and full market cap (e.g., "26.8T USD") for quick stats.
Overlay-Free: Designed for a separate pane to avoid cluttering your main XAUUSD chart.
Data Sources & Customization
Relies on live XAUUSD close prices from TradingView.
Supply input: Switch between "WGC Mid-2025" (default) or custom values—ideal for sensitivity analysis (e.g., adding future mining output).
No external API calls; fully self-contained for fast performance.
Usage Tips
For Gold Traders: Spot divergences between price momentum and cap growth to gauge overbought/oversold conditions.
Portfolio Context: Compare to S&P 500 cap (~$50T) or BTC (~$2T) by adding multi-symbol alerts.
Timeframes: Best on daily/weekly for long-term trends; works on 1H+ for intraday macro views.
Alerts: Set notifications for cap milestones (e.g., "Gold Cap > 28T") via TradingView's alert system.
Track gold's "infinite market cap" evolution—because unlike stocks, gold's supply grows slowly, amplifying price impact. Updated for 2025 data; feedback welcome! 🚀
Overview
This indicator calculates and visualizes the total market capitalization of gold in real-time, based on the current XAUUSD spot price and the estimated above-ground gold supply. It transforms the raw gold price into a scaled "market cap" view (in trillions USD), helping traders contextualize gold's global value—often compared to stocks, crypto, or fiat reserves. As of October 2025, gold's cap hovers around $26–27T, underscoring its status as a premier safe-haven asset.
How It Works
Core Formula: Market Cap = Gold Price (USD/oz) × Total Supply (troy oz), scaled to trillions for chart readability.
Supply Data: Defaults to the World Gold Council (WGC) mid-2025 estimate of ~218,000 metric tonnes (~7.01B troy oz), but customizable for scenarios like historical or projected figures.
Plotted as a smooth yellow line below the price pane, mirroring gold's price movements but in cap terms.
Key Features
Dynamic Label: A real-time label on the yellow line displays the exact market cap (e.g., "26.8") for instant reference, styled like popular TradingView cap indicators.
Reference Line: Horizontal dashed line at 25T USD to highlight key thresholds (e.g., surpassing Bitcoin's cap).
Info Table: Top-right panel shows current gold price and full market cap (e.g., "26.8T USD") for quick stats.
Overlay-Free: Designed for a separate pane to avoid cluttering your main XAUUSD chart.
Data Sources & Customization
Relies on live XAUUSD close prices from TradingView.
Supply input: Switch between "WGC Mid-2025" (default) or custom values—ideal for sensitivity analysis (e.g., adding future mining output).
No external API calls; fully self-contained for fast performance.
Usage Tips
For Gold Traders: Spot divergences between price momentum and cap growth to gauge overbought/oversold conditions.
Portfolio Context: Compare to S&P 500 cap (~$50T) or BTC (~$2T) by adding multi-symbol alerts.
Timeframes: Best on daily/weekly for long-term trends; works on 1H+ for intraday macro views.
Alerts: Set notifications for cap milestones (e.g., "Gold Cap > 28T") via TradingView's alert system.
Track gold's "infinite market cap" evolution—because unlike stocks, gold's supply grows slowly, amplifying price impact. Updated for 2025 data; feedback welcome! 🚀
Skrypt chroniony
Ten skrypt został opublikowany jako zamknięty kod źródłowy. Można z tego korzystać swobodnie i bez żadnych ograniczeń — więcej informacji znajduje się tutaj.
For Training visit.
Website wave-trader.com
Website techtradingacademy.com
Slack: wavetraders.slack.com
Telegram: t.me/Wavetraders
X: twitter.com/Wave__Trader
FB: facebook.com/WTimran
Website wave-trader.com
Website techtradingacademy.com
Slack: wavetraders.slack.com
Telegram: t.me/Wavetraders
X: twitter.com/Wave__Trader
FB: facebook.com/WTimran
Wyłączenie odpowiedzialności
Informacje i publikacje nie stanowią i nie powinny być traktowane jako porady finansowe, inwestycyjne, tradingowe ani jakiekolwiek inne rekomendacje dostarczane lub zatwierdzone przez TradingView. Więcej informacji znajduje się w Warunkach użytkowania.