PROTECTED SOURCE SCRIPT
Zaktualizowano Breakout Sideway Range [5ema]
This indicator can find the breakout of sideway range. The range create by the bars inside the highest bar.
Compared to my previous script name Breaking Bar, this one is different in important point:
-----
How to calculate?
-----
How to set up?
-----
How to use?
-----
This indicator is for reference only, you need your own method and strategy.
If you have any questions, please let me know in the comments.
Compared to my previous script name Breaking Bar, this one is different in important point:
- The Highest bar can be found at higher timeframe.
- No have opening candles of each session.
-----
How to calculate?
- Find the bar have full body or full bar is highest on number left bars.
- The sideway range are bars inside highest bar.
- Find the bar breakout highest bar are reversal candle patterns.
- The highest bar can set up on higher timeframe.
-----
How to set up?
- Change the input value of left bar to find the highest bar.
- Change the input value of right bar to find the inside bar of highest.
- Select the time frame to find the highest bar. Set "chart" if want to follow chart.
- Select the way find highest bar, by price high and low or open and close.
-----
How to use?
- Choose the signal buy or sell or all.
- Change the color or range if want.
- Hidden, display, change color background of signal bar.
- Make the alert when signal appear.
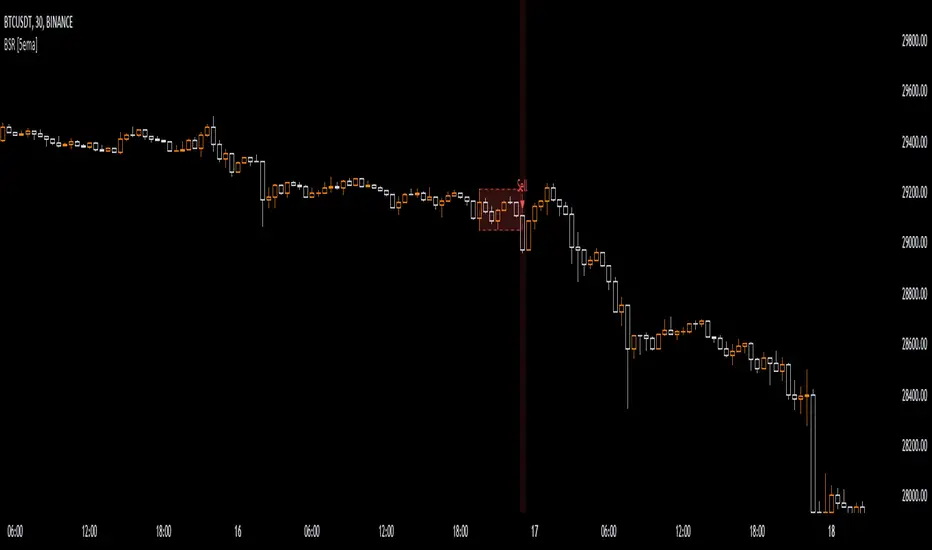
- Refer the signal appear on chart:
- Signal Sell:
- Signal Buy:
-----
This indicator is for reference only, you need your own method and strategy.
If you have any questions, please let me know in the comments.
Informacje o Wersji
Update:Change range and shape color, style.
Skrypt chroniony
Ten skrypt został opublikowany jako zamknięty kod źródłowy. Można z tego korzystać swobodnie i bez żadnych ograniczeń — więcej informacji znajduje się tutaj.
Wyłączenie odpowiedzialności
Informacje i publikacje nie stanowią i nie powinny być traktowane jako porady finansowe, inwestycyjne, tradingowe ani jakiekolwiek inne rekomendacje dostarczane lub zatwierdzone przez TradingView. Więcej informacji znajduje się w Warunkach użytkowania.