Key Levels
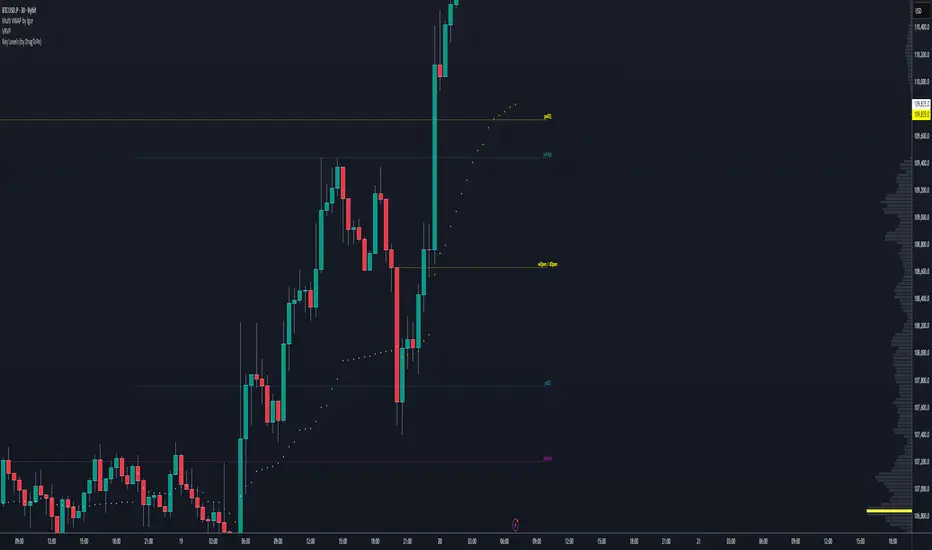
What It Shows
Daily Levels:
Daily Open
Previous Day High & Low
Previous Day Equilibrium (Midpoint)
Weekly Levels:
Previous Week High & Low
Previous Week Equilibrium
Monthly Levels:
Previous Month High & Low
Previous Month Equilibrium
Yearly Levels:
Previous Year High & Low
Previous Year Equilibrium
Features
Fully customizable colors, styles, and line types
Option to toggle each timeframe on/off
Works on any symbol or timeframe
Lightweight and non-intrusive
💡 Why Use It
Easily identify areas where price is likely to react — such as liquidity pools, range extremes, and institutional levels. Perfect for day traders, swing traders, and smart money concept users.
Skrypt tylko na zaproszenie
Tylko użytkownicy zatwierdzeni przez autora mogą uzyskać dostęp do tego skryptu. Musisz złożyć prośbę i uzyskać zgodę na jego użycie. Zazwyczaj jest ona udzielana po dokonaniu płatności. Aby uzyskać więcej informacji, postępuj zgodnie z instrukcjami autora poniżej lub skontaktuj się bezpośrednio z DragToPe.
TradingView NIE zaleca płacenia za skrypt ani jego używania, jeśli nie masz pełnego zaufania do jego autora i nie rozumiesz, jak działa. Możesz także znaleźć darmowe, open-source'owe alternatywy w naszej sekcji skryptów społecznościowych.
Instrukcje autora
Wyłączenie odpowiedzialności
Skrypt tylko na zaproszenie
Tylko użytkownicy zatwierdzeni przez autora mogą uzyskać dostęp do tego skryptu. Musisz złożyć prośbę i uzyskać zgodę na jego użycie. Zazwyczaj jest ona udzielana po dokonaniu płatności. Aby uzyskać więcej informacji, postępuj zgodnie z instrukcjami autora poniżej lub skontaktuj się bezpośrednio z DragToPe.
TradingView NIE zaleca płacenia za skrypt ani jego używania, jeśli nie masz pełnego zaufania do jego autora i nie rozumiesz, jak działa. Możesz także znaleźć darmowe, open-source'owe alternatywy w naszej sekcji skryptów społecznościowych.