PROTECTED SOURCE SCRIPT
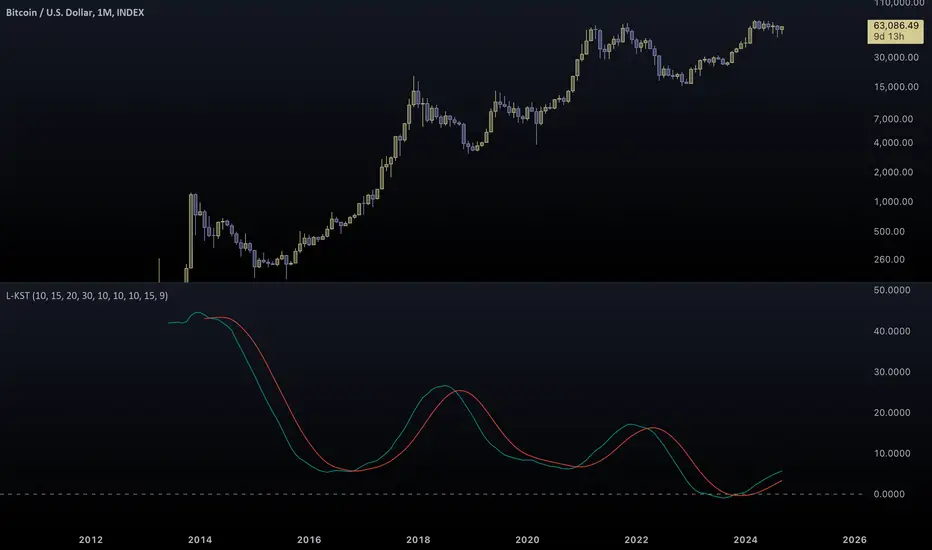
Log Know Sure Thing

The Know Sure Thing indicator (KST) is a momentum based oscillator. KST is based on Rate of Change (ROC). Know Sure Thing takes four different timeframes of ROC and smooth's them out using Simple Moving Averages. KST then calculates a final value that fluctuates between positive and negative values above and below a Zero Line. There is also a signal line which is an SMA of the KST line itself. Essentially, the Know Sure Thing Indicator measures the momentum of four separate price cycles. Technical Analysts use this information to spot divergences, overbought and oversold conditions and crossovers.
KST takes the Rate of Change for four different time periods, smooth's them out with moving averages, weights them and then sums the results. The intention is to get a better understanding of the momentum for a particular security of financial instrument. The general rule is that when KST is positive, then momentum is up and when KST is negative, then momentum is down. This would translate to Bullish and Bearish markets respectively.
The original Know Sure Thing indicator (KST) was developed by Martin Pring and introduced in 1992 in Stocks & Commodities Magazine. He originally referred to the indicator as the Summed Rate of Change.
This version of the indicator "Log Know Sure Thing" (L-KST) was developed by me as a refined solution to the original. Exponential charts like Bitcoin need exponential calculations. Simplistic approaches don't work in today's world. This indicator manages to adapt in all kinds of scenarios...
From negative charts:

(notice that the original KST breaks)
To extreme charts:

(again, the original doesn't manage to capture the Bitcoin oscillation)
If you are not familiar with KST, read the following analysis:
tradingview.com/support/solutions/43000502329-know-sure-thing-kst/
For a following version of this indicator I plan to incorporate actual overbought-oversold levels (if this doesn't mark the 20th).
Contrary to the original, this version of KST is bound to specific levels.
Stay tuned for that, it won't take long...
Tread lightly, for this is no-mans-land.
Use caution when using contraband indicators.
-Father Akikostas
KST takes the Rate of Change for four different time periods, smooth's them out with moving averages, weights them and then sums the results. The intention is to get a better understanding of the momentum for a particular security of financial instrument. The general rule is that when KST is positive, then momentum is up and when KST is negative, then momentum is down. This would translate to Bullish and Bearish markets respectively.
The original Know Sure Thing indicator (KST) was developed by Martin Pring and introduced in 1992 in Stocks & Commodities Magazine. He originally referred to the indicator as the Summed Rate of Change.
This version of the indicator "Log Know Sure Thing" (L-KST) was developed by me as a refined solution to the original. Exponential charts like Bitcoin need exponential calculations. Simplistic approaches don't work in today's world. This indicator manages to adapt in all kinds of scenarios...
From negative charts:
(notice that the original KST breaks)
To extreme charts:
(again, the original doesn't manage to capture the Bitcoin oscillation)
If you are not familiar with KST, read the following analysis:
tradingview.com/support/solutions/43000502329-know-sure-thing-kst/
For a following version of this indicator I plan to incorporate actual overbought-oversold levels (if this doesn't mark the 20th).
Contrary to the original, this version of KST is bound to specific levels.
Stay tuned for that, it won't take long...
Tread lightly, for this is no-mans-land.
Use caution when using contraband indicators.
-Father Akikostas
Skrypt chroniony
Ten skrypt został opublikowany jako zamknięty kod źródłowy. Można z tego korzystać swobodnie i bez żadnych ograniczeń — więcej informacji znajduje się tutaj.
Wyłączenie odpowiedzialności
Informacje i publikacje nie stanowią i nie powinny być traktowane jako porady finansowe, inwestycyjne, tradingowe ani jakiekolwiek inne rekomendacje dostarczane lub zatwierdzone przez TradingView. Więcej informacji znajduje się w Warunkach użytkowania.