BTCUSD Dzienny – Niedźwiedzie wybicie i scenariusz sprzedaży
Poniżej analiza wykresu po polsku:
Struktura rynku
Wyraźna sekwencja dystrybucja → wybicie w dół na interwale dziennym.
Szczyt utworzony w rejonie 95k, po czym nastąpiło odwrócenie trendu.
Strefa popytu 83–84k (na niebiesko) została wybita → zmiana struktury na niedźwiedzią.
Kluczowe poziomy
Główne wsparcie wybite: ~83–84k (obecnie opór)
Strefa podaży / strefa wejścia: ~72–74k (niebieska strefa „entry”)
Aktualne wsparcie: ~67,4k
Główny cel: ~60–62k (szara strefa popytu)
Analiza price action
Dynamiczny, pionowy spadek do ~67k wskazuje na silny impuls spadkowy, a nie zwykłą korektę.
Bazowy scenariusz to techniczne odbicie / konsolidacja w kierunku 72–74k.
Ta strefa pokrywa się z:
wcześniejszą konsolidacją
klasycznym niedźwiedzim retestem
presją sprzedażową od uwięzionych pozycji long
Pomysł na trade (zgodnie z wykresem)
Bias: Short
Wejście: Sprzedaż przy odrzuceniu ceny w strefie 72–74k
Invalidacja: Wyraźne dzienne zamknięcie powyżej ~75k
Cel: 60–62k (kolejna strefa popytu z wyższego TF)
Szerszy obraz
Dopóki BTC nie odzyska zdecydowanie poziomów 80k+, struktura rynku sprzyja kontynuacji spadków. Odbicia należy traktować jako okazje do sprzedaży, a nie sygnały zmiany trendu.
Cryptolevels

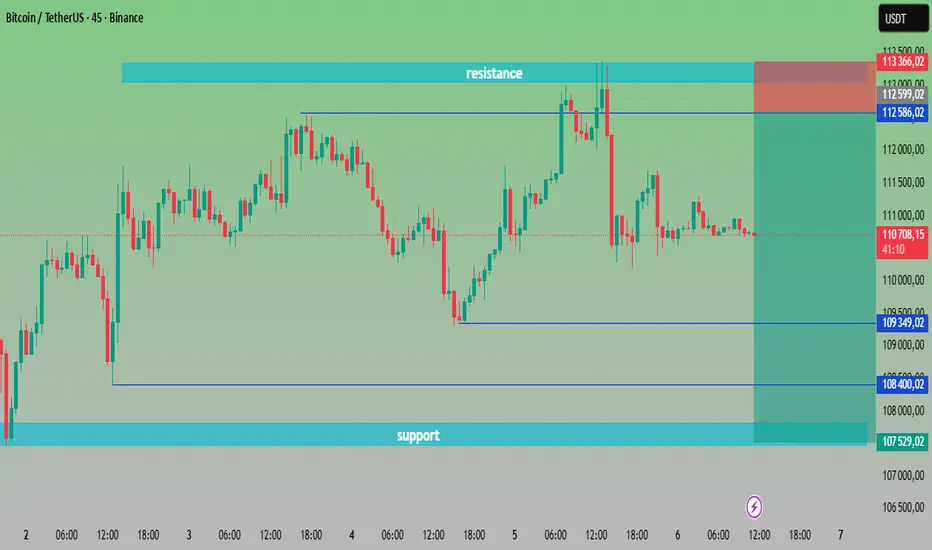
„BTC/USDT na rozdrożu | Kluczowe poziomy do obserwacji🔎 Analiza Wykresu – BTC/USDT (45m)
Strefa oporu: Około 112 586 – 113 200 USDT. Cena wielokrotnie testowała ten obszar, ale nie udało się przebić → silna presja sprzedażowa.
Strefa wsparcia: Około 107 529 – 108 400 USDT. Kupujący konsekwentnie bronili tego poziomu → ważna strefa popytu.
Aktualna cena: 110 720 USDT, znajduje się pomiędzy wsparciem a oporem.
📌 Scenariusze:
Scenariusz wzrostowy 🟢🚀 – Jeśli BTC wybije powyżej 112 586 USDT, dynamika może poprowadzić cenę w kierunku 113 500+ USDT.
Scenariusz spadkowy 🔴📉 – Jeśli BTC spadnie poniżej 109 349 USDT, możliwy jest ponowny test wsparcia w okolicach 107 500 USDT.
⚖️ Plan tradingowy:
Wejście Long: Przy wybiciu powyżej 112 600 ✅
Wejście Short: Przy spadku poniżej 109 300 ❌
Strefy docelowe:
Wzrost 🎯 → 113 500+
Spadek 🎯 → 107 500
„Bitcoin na krytycznym wsparciu – wybicie w stronę 119K czy ?Wybicie z kanału wzrostowego – Cena poruszała się w zielonym kanale wzrostowym, ale wybiła w dół, co wskazuje na słabość rynku.
Krytyczna strefa wsparcia: Około 111 946 – 114 000 $ (czarna linia trendu + żółta strefa wsparcia).
Poziomy oporu:
Krótkoterminowy: 115 100 – 115 582 $
Silny opór: 119 582 $ (oznaczony jako główny cel)
Profil wolumenu: Spadający wolumen przy ostatnim zjeździe → może sugerować akumulację przed kolejnym ruchem.
Chmura Ichimoku: Cena nieco poniżej chmury → krótkoterminowy sygnał spadkowy, ale możliwy odbicie w przypadku powrotu powyżej.
Scenariusze:
Wzrostowy (niebieskie/białe strzałki): Jeśli BTC utrzyma się powyżej 114 000 $ i wybije ponad 115 500 $, możliwy wzrost w kierunku 119 500 $+.
Spadkowy: Spadek poniżej 114 000 $ może sprowadzić cenę w okolice 111 946 $ (ważna strefa popytu).

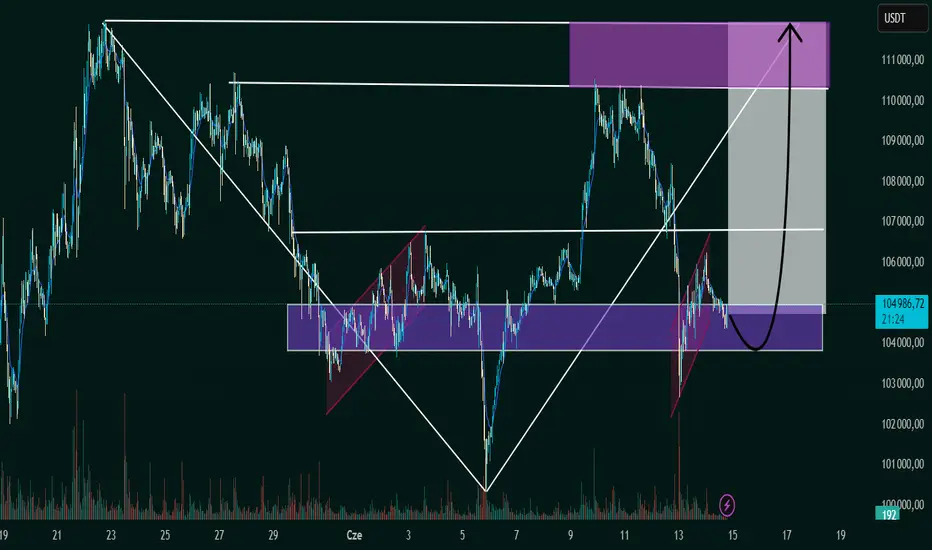
Analiza BTC/USDT – Strefa Potencjalnego Odwrócenia WzrostowegoStrefa wsparcia:
Pozioma fioletowa strefa (~104 000 USDT) kilkukrotnie działała jako silne wsparcie i opór.
Wybicie z klina spadkowego:
Cena wcześniej wybiła się z formacji klina spadkowego – klasyczny sygnał wzrostowy.
Formacja flagi (obecnie):
Obecnie tworzy się mniejsza formacja flagi wzrostowej. Wybicie górą może uruchomić silny ruch w górę.
Prognozowany ruch:
Czarna strzałka wskazuje możliwe odbicie od tej strefy z celem w rejonie 111 000–112 000 USDT (górna fioletowa strefa).
Wzrost wolumenu:
Zauważalny wzrost wolumenu w dolnej części wykresu może świadczyć o akumulacji.
📈 Wniosek:
Jeśli strefa wsparcia się utrzyma, a cena wybije z flagi w górę, możliwe jest kontynuowanie trendu wzrostowego w kierunku 111 000–112 000 USDT. Warto obserwować potwierdzenie wybicia i rosnący wolumen.
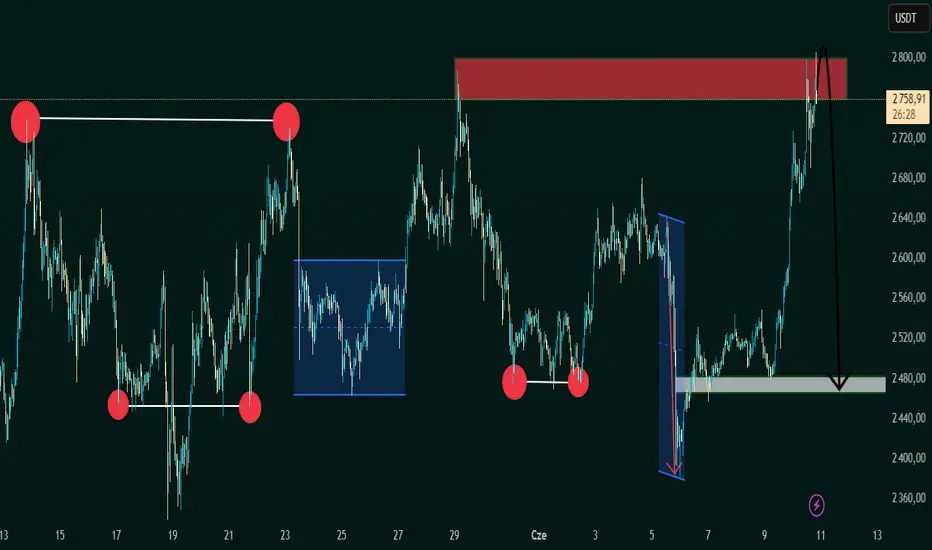
"Szansa na spadkowe odwrócenie po odrzuceniu ceny w strefie poda1. Formacja podwójnego szczytu (Double Top)
Na wykresie widoczna jest wyraźna formacja podwójnego szczytu w okolicach 2760–2800 USDT.
Obszar ten został oznaczony na czerwono jako strefa podaży, gdzie wcześniej pojawiła się silna presja sprzedażowa.
Cena ponownie dotknęła tej strefy i zaczęła wykazywać oznaki odrzucenia – potencjalny sygnał odwrócenia trendu.
2. Zgarnianie płynności (Liquidity Sweep)
Strzałka niebieska wskazuje długi dolny knot świecy – sygnał zgarniania płynności (tzw. „polowanie na stop lossy”) przez duże instytucje lub "Smart Money".
Po tym ruchu nastąpiło silne odbicie w górę.
3. Fazy akumulacji (Accumulation Phase)
Na wykresie zaznaczono kilka obszarów konsolidacji (niebieskie prostokąty), gdzie cena poruszała się w wąskim przedziale.
Po konsolidacji nastąpiło wybicie w górę – wskazujące na wzmożoną aktywność kupujących.
4. Formacja podwójnego dna (Double Bottom)
Strefa wokół poziomu 2480 USDT działa jako kluczowe wsparcie, testowane wielokrotnie.
Może to być docelowy poziom, jeśli rozpocznie się korekta spadkowa.
5. Strzałka spadkowa – prognoza
Duża czarna strzałka pokazuje oczekiwany kierunek ruchu ceny z poziomu 2800 w kierunku wsparcia na 2480 – potencjalny ruch korekcyjny w dół.
---
Wnioski i plan handlowy:
🔻 Prognoza: Spadkowa (krótkoterminowo)
Odrzucenie ceny w strefie podaży oraz formacja podwójnego szczytu sugerują możliwy zwrot trendu w dół.
Sygnał wejścia warto rozważyć po potwierdzeniu (np. formacja świecy spadkowej lub wybicie lokalnego wsparcia).
🧠 Przykładowy plan transakcyjny:
Wejście: Pozycja krótka (short) w okolicach 2780–2800 USDT po potwierdzeniu odrzucenia.
Take Profit (TP): 2480
Stop Loss (SL): powyżej 2820
Stosunek zysku do ryzyka: ok. 1:2.5 lub wyższy – zależnie od wejścia.
Odwrócona formacja głowy z ramionamiIdentyfikacja formacji:
Na wykresie wyraźnie zaznaczona jest klasyczna odwrócona formacja głowy z ramionami (Inverse Head and Shoulders):
Lewe ramię: Uformowane między 31 maja a 3 czerwca
Głowa: Najniższy punkt w okolicach 6 czerwca
Prawe ramię: Ukształtowane między 7 a 9 czerwca
Linia szyi: Poziomy opór w okolicach 106 840,37 USDT, obecnie pełniący funkcję wsparcia po wybiciu
Formacja ta jest silnym sygnałem odwrócenia trendu spadkowego na wzrostowy.
---
Potwierdzenie wybicia:
Aktualna cena: 107 586,58 USDT (powyżej linii szyi)
Status wybicia: Potwierdzone – świeca zamknięta powyżej linii szyi
Wzrost wolumenu: Sugerowany przez strzałkę wzrostową (choć wolumen nie jest pokazany, zazwyczaj towarzyszy takim wybiciom)
---
Kluczowe poziomy cenowe:
Rodzaj poziomu Cena (USDT)
Wsparcie 105 997,09
Retest / Linia szyi 106 840,37
Pierwszy cel 108 878,29
Docelowy poziom 110 752,24
---
Metoda projekcji:
Cel cenowy: Wyznaczony przez wysokość formacji (od dna głowy do linii szyi), następnie przeniesiony w górę od punktu wybicia.
Zielone pole i strzałka pokazują potencjalną ścieżkę wzrostu w kierunku 110 752,24 USDT.
Możliwy jest również retest linii szyi (106 840,37), co byłoby korzystne dla potwierdzenia wybicia i bezpieczniejszego wejścia.
---
Bias techniczny:
✅ Nastawienie wzrostowe
Wybicie z formacji IH&S
Cena utrzymuje się powyżej oporu
Wyraźna struktura rynku
---
Zarządzanie ryzykiem:
Poziom zanegowania: Spadek poniżej prawego ramienia (~105 997,09 USDT) może zanegować sygnał wzrostowy
Propozycja Stop-Loss: Poniżej 105 800 USDT (poniżej linii szyi i prawego ramienia)

BTC - zgodnie z analizą pnie się do góry - Cel $80 000Zgdodnie z wcześniejszymi analizami popyt na BTC utrzymał kontrolę.
Obecnie zmagamy się z ATH oraz dwoma górnymi bandami kanału wzrostowego.
W poprzednim wpisie zasugerowałem, że na wykresie H4 jeszcze nie mieliśmy dywergencji popytowej co sugerowało, potencjalnie jeszcze co najmniej jedno zejście w dół.
Tak też się stało. Pojawiła się ładna dywergencja na oscylatorze RSI i popyt zaatakował - dosyć skutecznie póki co.
Dobrym paliwem do wzrostów są już na 95% wygrane wybory przez Trumpa.
Cel zgodnie z poprzednimi analizami to okolice $80 000
------------------------------------------------------------------------------------
To wykres określa kierunek ruchu ceny - Fundamenty to “jedynie” paliwo

BTC - Popyt nadal utrzymuje kontrolę - wykres - D1.Podaż dosyć niemrawo próbuje zyskać przewagę po póki co nieudanym ataku popytu na ATH.
Ciekawym miejscem na próbę rozegrania pozycji kupna będą okolice $66 000
Znajduje się tam korekta równa w zasięgu co poprzednia korekta spadkowa, poprzednie szczyty z 24 września oraz strefa utrzymania trendu z D1.
Zobaczymy jak podaż sobie poradzi z tą strefą jeśli tam dotrze.
Na wykresie H4 brak dywergencji popytowej.
Cały czas w tle mamy wtorkowe wybory prezydenckie w USA i reakcje na ich wyniki na rynkach.
Mojej motto:
To wykres określa kierunek ruchu ceny - Fundamenty to “jedynie” paliwo
