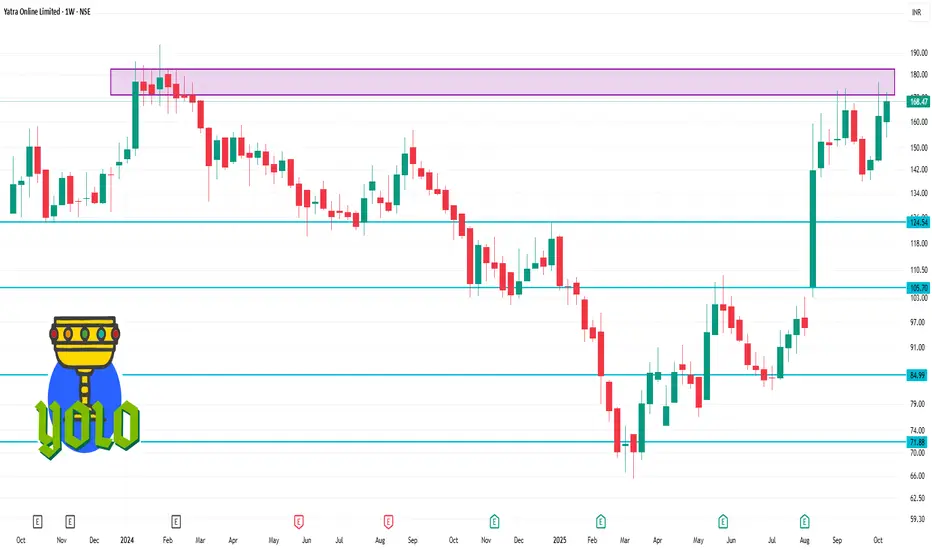
📈 1-Week Price Performance (Oct 10–Oct 17, 2025)
Opening Price (Oct 10): ₹162.23
Closing Price (Oct 17): ₹168.47
Weekly Gain: +3.85%
This upward trend indicates a steady recovery and positive sentiment among investors.
🔍 Key Highlights
52-Week Range: ₹65.51 – ₹176.66
Market Capitalization: ₹2,643.57 crore
P/E Ratio: 53.15
P/B Ratio: 3.29
Earnings Per Share (EPS): ₹3.09 (as of June 2025)
These metrics suggest that while the stock is trading at a premium, it reflects the market's expectations of future growth.
📊 Technical Indicators
50-Day Simple Moving Average (SMA): ₹148.20
200-Day SMA: ₹104.50
Relative Strength Index (RSI): 64.5 (indicating moderate bullish momentum)
Money Flow Index (MFI): 76.1 (approaching overbought territory)
These indicators suggest that the stock is in a strong uptrend, though investors should monitor for potential overbought conditions.
Powiązane publikacje
Wyłączenie odpowiedzialności
Informacje i publikacje nie stanowią i nie powinny być traktowane jako porady finansowe, inwestycyjne, tradingowe ani jakiekolwiek inne rekomendacje dostarczane lub zatwierdzone przez TradingView. Więcej informacji znajduje się w Warunkach użytkowania.