📚 Reversal chart Patterns: A Complete Beginner’s Guide
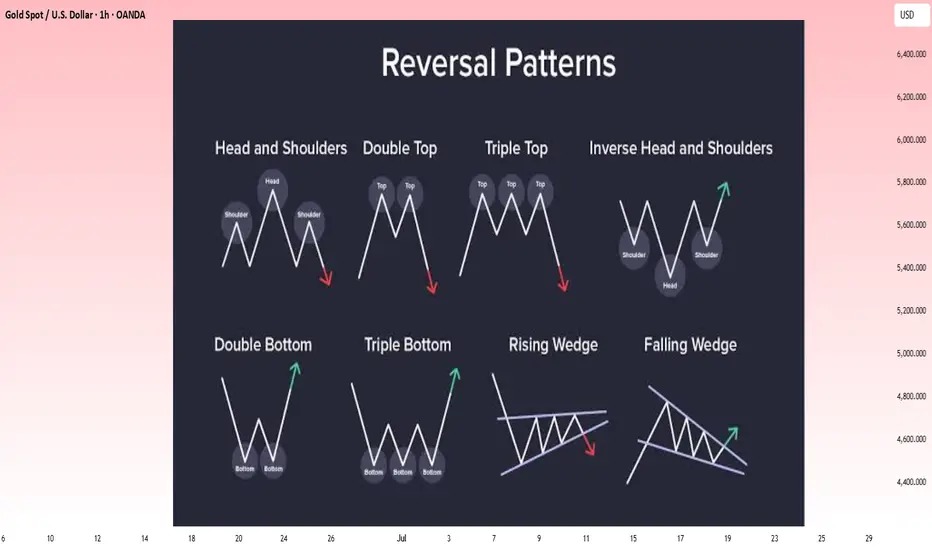
Reversal patterns signal that the current price trend may soon change direction. Recognizing them early can help traders prepare for potential market shifts. Below are the most common reversal patterns, each explained in a simple, structured way.
1️⃣ Head and Shoulders (Bearish Reversal)

What it is: Appears after an uptrend and signals a possible move downward.
How to spot it: Left Shoulder: Price rises, peaks, then falls. Head: Price rises again,
reaching a higher peak, then drops. Right Shoulder: Price rises once more but peaks
lower than the head. Neckline: A support line drawn through the lows of the left and right shoulders. Why it matters: A break below the neckline suggests sellers have taken control,
increasing the probability of a downtrend.
2️⃣ Double Top (Bearish Reversal)

What it is: A two-peak pattern signaling the end of an uptrend.
How to spot it:Price rises to a high (first top), retraces, then rises again
to a similar high (second top). The trough between the tops acts as key support.
The pattern is confirmed when price breaks below that support. Why it matters:
Failure to break higher on the second attempt suggests buying pressure is fading
often leading to a decline.
3️⃣ Triple Top (Bearish Reversal)

What it is: Similar to the Double Top, but with three peaks at roughly
the same level. How to spot it: Three attempts to break above the same
resistance level, each followed by a pullback. A break below the lowest point
between the tops confirms the pattern. Why it matters: Multiple failed breakouts
reinforce the idea that resistance is strong and sellers are likely to push price downward.
4️⃣ Inverse Head and Shoulders (Bullish Reversal)

What it is: The upside-down version of the Head and Shoulders,
signaling a possible move upward after a downtrend. How to spot it:
Left Shoulder: Price falls, bottoms, then rises. Head: Price falls further
to a deeper low, then rebounds. Right Shoulder: Price drops again, but bottoms
higher than the head. Neckline: A resistance line drawn through the highs of the left
and right shoulders. Why it matters: A breakout above the neckline suggests buyers are
gaining strength increasing the probability of an uptrend.
5️⃣ Double Bottom (Bullish Reversal)

What it is: A two-trough pattern signaling the end of a downtrend.
How to spot it: Price falls to a low (first bottom), rebounds, then falls
again to a similar low (second bottom). The peak between the bottoms serves
as resistance. The pattern is confirmed when price breaks above that resistance.
Why it matters: Shows that buyers are stepping in at the same level twice, indicating
a strong support zone and potential trend reversal upward.
6️⃣ Triple Bottom (Bullish Reversal)

What it is: Similar to the Double Bottom, but with three troughs
at roughly the same level. How to spot it: Three failed attempts to break
below a key support level. A breakout above the highest point between the bottoms
confirms the pattern. Why it matters: Repeated support tests without breakdown suggest sellers are losing control, paving the way for a bullish move.
7️⃣ Rising Wedge (Bearish continue)

What it is: A narrowing upward-sloping price range that often precedes
a downward breakout. How to spot it: Both highs and lows are rising, but the
lows are rising faster. The wedge narrows over time. A confirmed breakdown happens
when price falls below the lower trendline. Why it matters: The slowing momentum in
higher highs signals buyer exhaustion, increasing the odds of a bearish reversal.
8️⃣ Falling Wedge (Bullish continue)

What it is: A narrowing downward-sloping price range that often precedes an
upward breakout. How to spot it: Both highs and lows are falling, but the lows are
falling more slowly than the highs. The wedge narrows over time. A breakout above the
upper trendline confirms the reversal. Why it matters: The slowing pace of lower lows suggests sellers are weakening, making a bullish reversal more likely.
💡 Trading Tip:
Reversal patterns are more reliable when confirmed by additional indicators like volume spikes, RSI divergence, or MACD crossovers. Always use proper risk management to protect your capital.
Reversal patterns signal that the current price trend may soon change direction. Recognizing them early can help traders prepare for potential market shifts. Below are the most common reversal patterns, each explained in a simple, structured way.
1️⃣ Head and Shoulders (Bearish Reversal)
What it is: Appears after an uptrend and signals a possible move downward.
How to spot it: Left Shoulder: Price rises, peaks, then falls. Head: Price rises again,
reaching a higher peak, then drops. Right Shoulder: Price rises once more but peaks
lower than the head. Neckline: A support line drawn through the lows of the left and right shoulders. Why it matters: A break below the neckline suggests sellers have taken control,
increasing the probability of a downtrend.
2️⃣ Double Top (Bearish Reversal)
What it is: A two-peak pattern signaling the end of an uptrend.
How to spot it:Price rises to a high (first top), retraces, then rises again
to a similar high (second top). The trough between the tops acts as key support.
The pattern is confirmed when price breaks below that support. Why it matters:
Failure to break higher on the second attempt suggests buying pressure is fading
often leading to a decline.
3️⃣ Triple Top (Bearish Reversal)
What it is: Similar to the Double Top, but with three peaks at roughly
the same level. How to spot it: Three attempts to break above the same
resistance level, each followed by a pullback. A break below the lowest point
between the tops confirms the pattern. Why it matters: Multiple failed breakouts
reinforce the idea that resistance is strong and sellers are likely to push price downward.
4️⃣ Inverse Head and Shoulders (Bullish Reversal)
What it is: The upside-down version of the Head and Shoulders,
signaling a possible move upward after a downtrend. How to spot it:
Left Shoulder: Price falls, bottoms, then rises. Head: Price falls further
to a deeper low, then rebounds. Right Shoulder: Price drops again, but bottoms
higher than the head. Neckline: A resistance line drawn through the highs of the left
and right shoulders. Why it matters: A breakout above the neckline suggests buyers are
gaining strength increasing the probability of an uptrend.
5️⃣ Double Bottom (Bullish Reversal)
What it is: A two-trough pattern signaling the end of a downtrend.
How to spot it: Price falls to a low (first bottom), rebounds, then falls
again to a similar low (second bottom). The peak between the bottoms serves
as resistance. The pattern is confirmed when price breaks above that resistance.
Why it matters: Shows that buyers are stepping in at the same level twice, indicating
a strong support zone and potential trend reversal upward.
6️⃣ Triple Bottom (Bullish Reversal)
What it is: Similar to the Double Bottom, but with three troughs
at roughly the same level. How to spot it: Three failed attempts to break
below a key support level. A breakout above the highest point between the bottoms
confirms the pattern. Why it matters: Repeated support tests without breakdown suggest sellers are losing control, paving the way for a bullish move.
7️⃣ Rising Wedge (Bearish continue)
What it is: A narrowing upward-sloping price range that often precedes
a downward breakout. How to spot it: Both highs and lows are rising, but the
lows are rising faster. The wedge narrows over time. A confirmed breakdown happens
when price falls below the lower trendline. Why it matters: The slowing momentum in
higher highs signals buyer exhaustion, increasing the odds of a bearish reversal.
8️⃣ Falling Wedge (Bullish continue)
What it is: A narrowing downward-sloping price range that often precedes an
upward breakout. How to spot it: Both highs and lows are falling, but the lows are
falling more slowly than the highs. The wedge narrows over time. A breakout above the
upper trendline confirms the reversal. Why it matters: The slowing pace of lower lows suggests sellers are weakening, making a bullish reversal more likely.
💡 Trading Tip:
Reversal patterns are more reliable when confirmed by additional indicators like volume spikes, RSI divergence, or MACD crossovers. Always use proper risk management to protect your capital.
💲𝗙𝗢𝗥𝗘𝗫 < 𝗚𝗢𝗟𝗗 > ₿ 𝗕𝗧𝗖 || Real Trades, Real Results || VIP Signals {My Personal Entries} Join Telegram – Trade smarter
t.me/JosProTrader
World best broker Exness⤵️
one.exnesstrack.org/a/u111qxzio3
t.me/JosProTrader
World best broker Exness⤵️
one.exnesstrack.org/a/u111qxzio3
Powiązane publikacje
Wyłączenie odpowiedzialności
Informacje i publikacje przygotowane przez TradingView lub jego użytkowników, prezentowane na tej stronie, nie stanowią rekomendacji ani porad handlowych, inwestycyjnych i finansowych i nie powinny być w ten sposób traktowane ani wykorzystywane. Więcej informacji na ten temat znajdziesz w naszym Regulaminie.