Greetings my people.
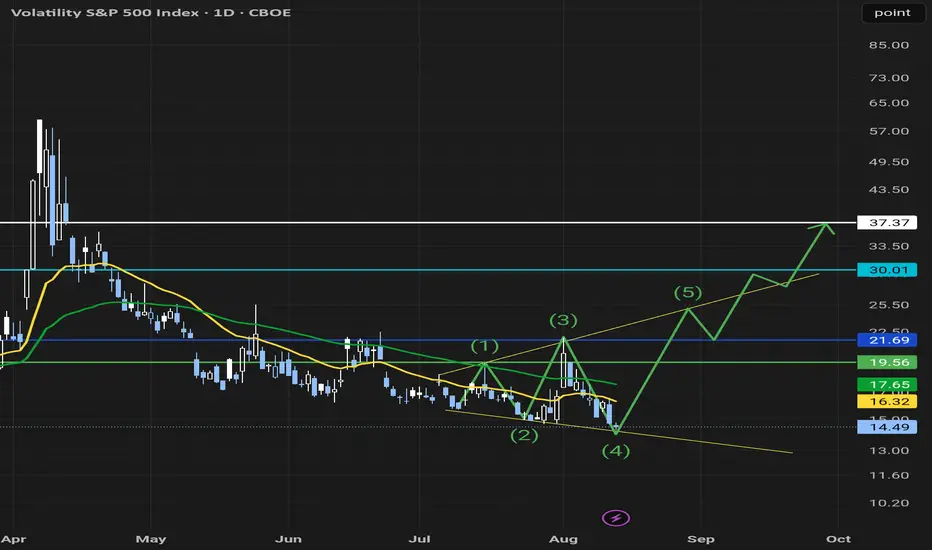
This is what I am seeing for VIX.US. 5 wave megaphone on the daily. Each vertical line corresponds to liquidity gaps that are still present. We had a very similar pattern on SPY.US I personally played, but I have not posted it on here. I'll start sharing my ideas more often as I get more used to using this. 😅 Perhaps it might look a bit exagerated however If you break down SPY.US in small sections on the 4h, its really just a few patterns that repeat in 3s for each circle. After each circle is complete it drops to a lower level from which it rebounds and begins a new circle of 3 reoccurring patterns. After the completion of each such cycles the pull back is bigger with the third one being the biggest like the one we had last April which was basically the end of the 3rd and final cycle. We have been in curently in cycle one of the new phase and curently working our way up and towards the completing of the 3rd reoccurring pattern in cycle one. I know it likely makes zero sense at the moment, if youre interested and I get enough requests ill take the time and make a post about it.
This is what I am seeing for VIX.US. 5 wave megaphone on the daily. Each vertical line corresponds to liquidity gaps that are still present. We had a very similar pattern on SPY.US I personally played, but I have not posted it on here. I'll start sharing my ideas more often as I get more used to using this. 😅 Perhaps it might look a bit exagerated however If you break down SPY.US in small sections on the 4h, its really just a few patterns that repeat in 3s for each circle. After each circle is complete it drops to a lower level from which it rebounds and begins a new circle of 3 reoccurring patterns. After the completion of each such cycles the pull back is bigger with the third one being the biggest like the one we had last April which was basically the end of the 3rd and final cycle. We have been in curently in cycle one of the new phase and curently working our way up and towards the completing of the 3rd reoccurring pattern in cycle one. I know it likely makes zero sense at the moment, if youre interested and I get enough requests ill take the time and make a post about it.
Wyłączenie odpowiedzialności
Informacje i publikacje przygotowane przez TradingView lub jego użytkowników, prezentowane na tej stronie, nie stanowią rekomendacji ani porad handlowych, inwestycyjnych i finansowych i nie powinny być w ten sposób traktowane ani wykorzystywane. Więcej informacji na ten temat znajdziesz w naszym Regulaminie.