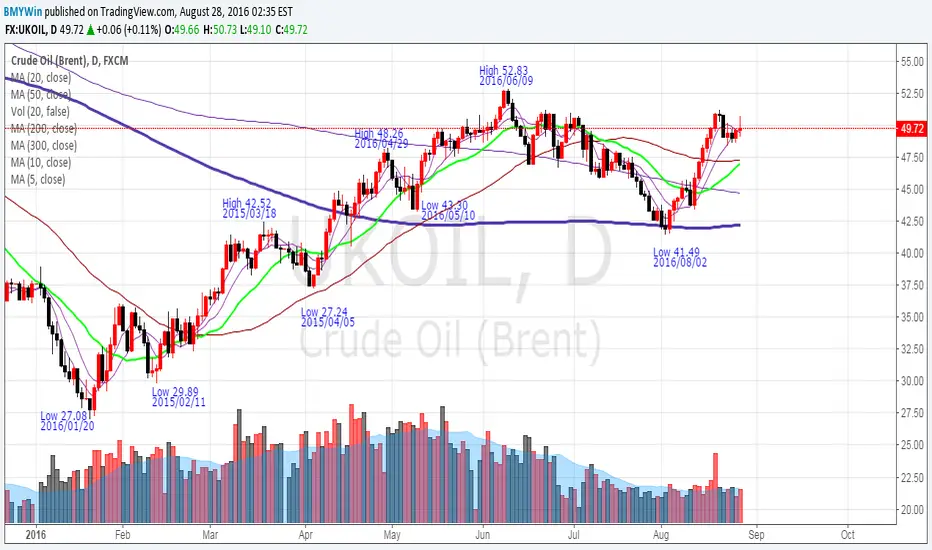
After 3 weeks going up from 41.59 to 51.19, last week it take a rest pull back. Pull back but still keeping above 10 days MA.
Daily: Friday close > 10MAD > 5MAD > MAD 50 > MAD20 > MAD 300 > MAD200. A short term moderate bullish signal.
Weekly: Close > MA3> MA20> MA10 > MA5 > MA50. Medium term bullish.
Transaction volume remain equal to 20 days average, but lower than previous bullish wave transaction volume. Bullish momentum is still lack of enough volume energy to push it going higher high.
Let's observe will the price lower low than last week low (48.45), or higher high than last week high(50.83)?
We guess Maybe next week will be still in a range trading for developing a standard triangle for finding new direction.
We stop our profit for our all of our long position after price drop 49.50 on 2016/08/22. We are still expecting the price can pull back a little bit lower said around 48.22 or 47.31, then maybe we will enter our long position again. But if price go up to have a higher high then last week,we might consider to have our long position again, it depends on transaction volume.
Wyłączenie odpowiedzialności
Informacje i publikacje przygotowane przez TradingView lub jego użytkowników, prezentowane na tej stronie, nie stanowią rekomendacji ani porad handlowych, inwestycyjnych i finansowych i nie powinny być w ten sposób traktowane ani wykorzystywane. Więcej informacji na ten temat znajdziesz w naszym Regulaminie.