The Fibonacci proportions are a widely used technical tool in financial markets. They are based on the Fibonacci sequence, a numerical series introduced to the West by the Italian mathematician Leonardo de Pisa (13th century) after his travels in the Mediterranean (especially in Béjaïa, Algeria): 0, 1, 1, 2, 3, 5, 8, 13, 21, 34, 55, 89, 144..., where each number is the sum of the two preceding ones.
Although Ralph Nelson Elliott incorporated concepts related to Fibonacci ratios in his wave theory (published in 1938), it was Charles Collins who first explicitly used price retracements and extensions in the 1940s.
I will divide the content into three parts to enhance understanding of this approach: Fibonacci Retracements, Fibonacci Extensions, and Harmonic Alignments.
Fibonacci Ratios
In trading, the sequence itself is not used directly but rather its ratios, which approximate natural proportions observed in nature, art, and price patterns.
The ratio of any number to the next higher number approaches 0.618 after the first four numbers. For example, 1/1 is 1.00, 1/2 is 0.50, 2/3 is 0.67, 3/5 is 0.60, 5/8 is 0.625, 8/13 is 0.615, 13/21 is 0.619, etc. (pay attention to the value 0.50).
The ratio of any number to the preceding lower number is approximately 1.618, or the inverse of 0.618. For example, 13/8 is 1.625, 21/13 is 1.615, 34/21 is 1.619. The higher the numbers, the closer they get to 0.618 and 1.618.
The ratios of alternate numbers approximate 2.618 or its inverse, 0.382. For example, 13/34 is 0.382, 34/13 is 2.615.
0.786 is the square root of 0.618.
Personal Perspective on Fibonacci Proportions
None of the ratios we will explore below possess magical properties. The truly decisive factor is price action, which acts as a mirror of the collective psychology of investors. Fibonacci proportions are excellent for highlighting proportionality and harmony, aspects that directly influence participants' decisions. This is where the importance of this approach lies.
Fibonacci Retracement Adjustments
In Figure 1, you can see how to correctly draw Fibonacci retracements in an uptrend: from bottom to top, from the low of the impulse (1) (including the lower wicks or shadows) to the upper high (2) (considering its wicks or shadows). The clearer and more defined these impulses are, the greater their influence on market participants' psychology. Clarity ensures better results when studying tools, indicators, or price action.
I discard the 0.236 level in my trading, but you can include it and experiment.
Timeframe is also important to consider: applying Fibonacci on 5-minute charts, for example, would be like trying to control the ocean with a measuring tape. As I demonstrated in the article “Timeframe is Everything”, lower timeframes degrade the success rate due to the greater influence of news and rumors, high-frequency trading, lower capitalization, and interests, etc.
If the drawing is incorrect, the values will not match those in the image, and the diagonal line will point downward.
Figure 1

In Figure 2, I show the correct drawing of Fibonacci retracements in a downtrend, from top to bottom, from the high of the impulse (1) (including the lower wicks or shadows) to the low (2) (considering its wicks or shadows). If the drawing is incorrect, the values will not match, and the diagonal line will point upward.
Figure 2:

Psychology of the Ratios
Ratio 0.382
This ratio is extremely useful for avoiding premature entries in favor of the trend. In my experience, in most cases, we should wait for the price to touch the 0.382 level unless a consistent price formation justifies a trend continuation.
This level indicates a typical retracement zone, making it ideal for detecting "pauses" in strong trends. It is also necessary that entries at this and other ratios we will study are validated by price action and context.
In Figure 3, you can observe how the price offers an excellent reversal opportunity at the 0.382 Fibonacci level. A previously respected 50 EMA and a strong point like the 50% of the body of a weekly engulfing candle increase the robustness of the zone. The confirmation of price action manifests in increased volumes that may signal a likely reversal and a bullish engulfing candle.
Figure 3

I won’t provide examples in downtrends for this level, as the buying pressure inherent in market nature makes short entries based on the 0.382 level very unstable. Thus, this ratio is primarily evident in uptrends.
Ratio 0.50
It is generally believed that this ratio does not belong to the Fibonacci sequence, but 0.50 is a harmonic starting point in the progression.
It marks a balance between supply and demand, thus serving as a psychological magnet that tends to attract the price while delineating a battle zone between buyers and sellers.
In Figure 4, you can see the correct use of the level: The 0.50 ratio is perfectly aligned with the presence of a 50 SMA and price action elements like a ceiling test, offering extremely robust resistance. An island gap pattern is an excellent reversal signal to confirm a short entry.
Figure 4

In Figure 5, we observe the alignment of the 0.50 level with the presence of a large gap acting as robust support. Additionally, the level coincides with the 50% of the body of a bullish engulfing candle on a weekly chart, adding significant confidence. The price action would confirm an entry with a large bullish engulfing candle.
Figure 5

Ratio 0.618 (Golden Ratio)
The 0.618 ratio is a universal "equilibrium point" in crowd psychology; the place where many investors expect a bounce, as it represents a deep but not exhaustive correction.
Studies and tests (such as those by Robert Prechter in Elliott Wave Principle) show that the 61.8% level appears in up to 70% of significant corrections in indices like the S&P 500 or Dow Jones, while behavioral economists argue that its "success" is more due to confirmation bias than strict causality.
In Figure 6, we observe how the golden ratio (0.618) aligns with a high order volume zone (volume profile). The noticeable weakness in price action, graphically represented in oscillators like the MACD (bearish divergence), combined with a volume spike, could provide clues about a likely rejection in the zone.
Figure 6

In Figure 7, we observe a bullish example where the 0.618 level aligns with a strong support generated by accumulation. Note how this zone shows a high order volume (volume profile). This support was also backed by a 20 EMA on a weekly chart. The price action would confirm the entry after several rejection candles.
Figure 7

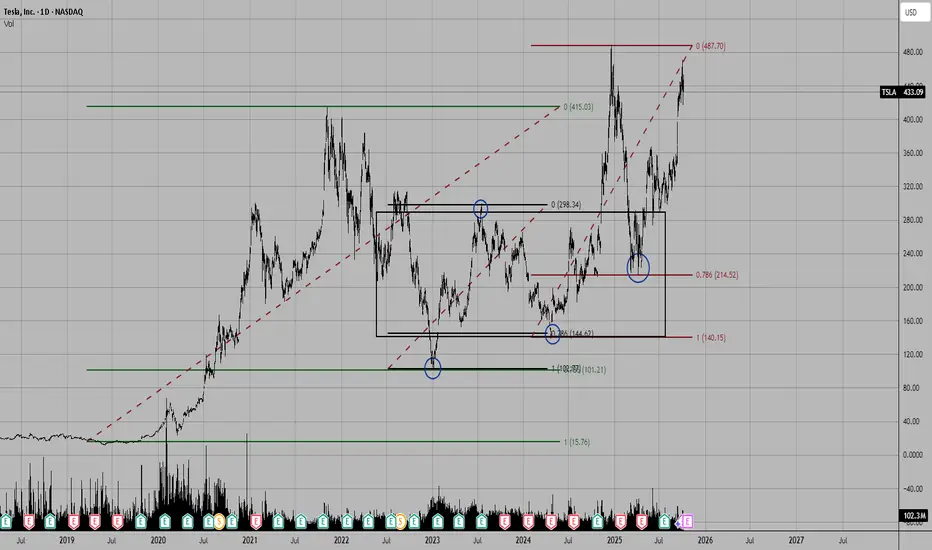
Ratio 0.786
This is my favorite Fibonacci retracement ratio, and I use it exclusively to seek reversals in uptrends. It indicates trend weakness, but I like to consider it a high-probability reaction zone, as selling pressure in such a deep correction tends to be weak, while large participants or institutions may see a good opportunity to buy low.
I apply this ratio exclusively to double bottoms, as seen in Figures 8 and 9.
Figure 8

Figure 9

In Figure 8, the 0.786 level aligns with the 50% of a monthly engulfing candle and a large gap visible on the daily chart. Additionally, volume and a large engulfing candle pattern would have confirmed the entry well.
Figure 9 shows an alignment between the 0.786 level and a strong support on the daily chart. In the same zone, a 20 EMA on a weekly chart coincides. The price action confirmation manifests in compression and an explosion of bullish volatility.
Fun Facts
1-Leonardo de Pisa (or Leonardo Pisano) was born around 1170 in Pisa, Italy, and was the son of Guglielmo Bonacci, a commercial official working in North Africa.
The nickname Fibonacci comes from "filius Bonacci," which in Latin literally means "son of Bonacci." He signed his works as "Leonardo, son of Bonacci, Pisan," but the term "Fibonacci" was shortened and popularized centuries later.
2-The Fibonacci numerical series actually dates back to ancient Indian texts (such as those by Pingala in the 2nd century BC, used for poetic meter).
3-Leonardo de Pisa popularized the numerical series in Western Europe through his book, Liber Abaci (1202), where he used it to solve practical problems, such as rabbit population growth (the famous example: a pair of rabbits produces a sequence of births generating the numbers 1, 1, 2, 3, 5, 8...).
Conclusions
Fibonacci proportions are a valuable complement, but not the holy grail. In my strategies, I find them extremely useful and feel comfortable incorporating them in specific contexts, though not all systems require them. For example, I like having a Fibonacci at hand in patterns like double bottoms to identify key supports or when a price overextends or retraces strongly, delineating potential reversal zones.
I recommend that investors avoid chasing mystical numerical alignments and maintain a logical approach to each tool, method, or pattern studied.
Final Note
If you want to take a look at my analysis record, you can find my profile in Spanish, where I transparently share well-defined market entries. Send your good vibes if you enjoyed this article, and may God bless you all.
Although Ralph Nelson Elliott incorporated concepts related to Fibonacci ratios in his wave theory (published in 1938), it was Charles Collins who first explicitly used price retracements and extensions in the 1940s.
I will divide the content into three parts to enhance understanding of this approach: Fibonacci Retracements, Fibonacci Extensions, and Harmonic Alignments.
Fibonacci Ratios
In trading, the sequence itself is not used directly but rather its ratios, which approximate natural proportions observed in nature, art, and price patterns.
The ratio of any number to the next higher number approaches 0.618 after the first four numbers. For example, 1/1 is 1.00, 1/2 is 0.50, 2/3 is 0.67, 3/5 is 0.60, 5/8 is 0.625, 8/13 is 0.615, 13/21 is 0.619, etc. (pay attention to the value 0.50).
The ratio of any number to the preceding lower number is approximately 1.618, or the inverse of 0.618. For example, 13/8 is 1.625, 21/13 is 1.615, 34/21 is 1.619. The higher the numbers, the closer they get to 0.618 and 1.618.
The ratios of alternate numbers approximate 2.618 or its inverse, 0.382. For example, 13/34 is 0.382, 34/13 is 2.615.
0.786 is the square root of 0.618.
Personal Perspective on Fibonacci Proportions
None of the ratios we will explore below possess magical properties. The truly decisive factor is price action, which acts as a mirror of the collective psychology of investors. Fibonacci proportions are excellent for highlighting proportionality and harmony, aspects that directly influence participants' decisions. This is where the importance of this approach lies.
Fibonacci Retracement Adjustments
In Figure 1, you can see how to correctly draw Fibonacci retracements in an uptrend: from bottom to top, from the low of the impulse (1) (including the lower wicks or shadows) to the upper high (2) (considering its wicks or shadows). The clearer and more defined these impulses are, the greater their influence on market participants' psychology. Clarity ensures better results when studying tools, indicators, or price action.
I discard the 0.236 level in my trading, but you can include it and experiment.
Timeframe is also important to consider: applying Fibonacci on 5-minute charts, for example, would be like trying to control the ocean with a measuring tape. As I demonstrated in the article “Timeframe is Everything”, lower timeframes degrade the success rate due to the greater influence of news and rumors, high-frequency trading, lower capitalization, and interests, etc.
If the drawing is incorrect, the values will not match those in the image, and the diagonal line will point downward.
Figure 1
In Figure 2, I show the correct drawing of Fibonacci retracements in a downtrend, from top to bottom, from the high of the impulse (1) (including the lower wicks or shadows) to the low (2) (considering its wicks or shadows). If the drawing is incorrect, the values will not match, and the diagonal line will point upward.
Figure 2:
Psychology of the Ratios
Ratio 0.382
This ratio is extremely useful for avoiding premature entries in favor of the trend. In my experience, in most cases, we should wait for the price to touch the 0.382 level unless a consistent price formation justifies a trend continuation.
This level indicates a typical retracement zone, making it ideal for detecting "pauses" in strong trends. It is also necessary that entries at this and other ratios we will study are validated by price action and context.
In Figure 3, you can observe how the price offers an excellent reversal opportunity at the 0.382 Fibonacci level. A previously respected 50 EMA and a strong point like the 50% of the body of a weekly engulfing candle increase the robustness of the zone. The confirmation of price action manifests in increased volumes that may signal a likely reversal and a bullish engulfing candle.
Figure 3
I won’t provide examples in downtrends for this level, as the buying pressure inherent in market nature makes short entries based on the 0.382 level very unstable. Thus, this ratio is primarily evident in uptrends.
Ratio 0.50
It is generally believed that this ratio does not belong to the Fibonacci sequence, but 0.50 is a harmonic starting point in the progression.
It marks a balance between supply and demand, thus serving as a psychological magnet that tends to attract the price while delineating a battle zone between buyers and sellers.
In Figure 4, you can see the correct use of the level: The 0.50 ratio is perfectly aligned with the presence of a 50 SMA and price action elements like a ceiling test, offering extremely robust resistance. An island gap pattern is an excellent reversal signal to confirm a short entry.
Figure 4
In Figure 5, we observe the alignment of the 0.50 level with the presence of a large gap acting as robust support. Additionally, the level coincides with the 50% of the body of a bullish engulfing candle on a weekly chart, adding significant confidence. The price action would confirm an entry with a large bullish engulfing candle.
Figure 5
Ratio 0.618 (Golden Ratio)
The 0.618 ratio is a universal "equilibrium point" in crowd psychology; the place where many investors expect a bounce, as it represents a deep but not exhaustive correction.
Studies and tests (such as those by Robert Prechter in Elliott Wave Principle) show that the 61.8% level appears in up to 70% of significant corrections in indices like the S&P 500 or Dow Jones, while behavioral economists argue that its "success" is more due to confirmation bias than strict causality.
In Figure 6, we observe how the golden ratio (0.618) aligns with a high order volume zone (volume profile). The noticeable weakness in price action, graphically represented in oscillators like the MACD (bearish divergence), combined with a volume spike, could provide clues about a likely rejection in the zone.
Figure 6
In Figure 7, we observe a bullish example where the 0.618 level aligns with a strong support generated by accumulation. Note how this zone shows a high order volume (volume profile). This support was also backed by a 20 EMA on a weekly chart. The price action would confirm the entry after several rejection candles.
Figure 7
Ratio 0.786
This is my favorite Fibonacci retracement ratio, and I use it exclusively to seek reversals in uptrends. It indicates trend weakness, but I like to consider it a high-probability reaction zone, as selling pressure in such a deep correction tends to be weak, while large participants or institutions may see a good opportunity to buy low.
I apply this ratio exclusively to double bottoms, as seen in Figures 8 and 9.
Figure 8
Figure 9
In Figure 8, the 0.786 level aligns with the 50% of a monthly engulfing candle and a large gap visible on the daily chart. Additionally, volume and a large engulfing candle pattern would have confirmed the entry well.
Figure 9 shows an alignment between the 0.786 level and a strong support on the daily chart. In the same zone, a 20 EMA on a weekly chart coincides. The price action confirmation manifests in compression and an explosion of bullish volatility.
Fun Facts
1-Leonardo de Pisa (or Leonardo Pisano) was born around 1170 in Pisa, Italy, and was the son of Guglielmo Bonacci, a commercial official working in North Africa.
The nickname Fibonacci comes from "filius Bonacci," which in Latin literally means "son of Bonacci." He signed his works as "Leonardo, son of Bonacci, Pisan," but the term "Fibonacci" was shortened and popularized centuries later.
2-The Fibonacci numerical series actually dates back to ancient Indian texts (such as those by Pingala in the 2nd century BC, used for poetic meter).
3-Leonardo de Pisa popularized the numerical series in Western Europe through his book, Liber Abaci (1202), where he used it to solve practical problems, such as rabbit population growth (the famous example: a pair of rabbits produces a sequence of births generating the numbers 1, 1, 2, 3, 5, 8...).
Conclusions
Fibonacci proportions are a valuable complement, but not the holy grail. In my strategies, I find them extremely useful and feel comfortable incorporating them in specific contexts, though not all systems require them. For example, I like having a Fibonacci at hand in patterns like double bottoms to identify key supports or when a price overextends or retraces strongly, delineating potential reversal zones.
I recommend that investors avoid chasing mystical numerical alignments and maintain a logical approach to each tool, method, or pattern studied.
Final Note
If you want to take a look at my analysis record, you can find my profile in Spanish, where I transparently share well-defined market entries. Send your good vibes if you enjoyed this article, and may God bless you all.
📖Revista El Especulador (publicación mensual):
drive.google.com/file/d/1Fs8l9xSpZIy5haCb5l0HWzgeAanOifs_/view?usp=drivesdk
👉t.me/ElEspeculador96 (Telegram)
drive.google.com/file/d/1Fs8l9xSpZIy5haCb5l0HWzgeAanOifs_/view?usp=drivesdk
👉t.me/ElEspeculador96 (Telegram)
Wyłączenie odpowiedzialności
Informacje i publikacje przygotowane przez TradingView lub jego użytkowników, prezentowane na tej stronie, nie stanowią rekomendacji ani porad handlowych, inwestycyjnych i finansowych i nie powinny być w ten sposób traktowane ani wykorzystywane. Więcej informacji na ten temat znajdziesz w naszym Regulaminie.