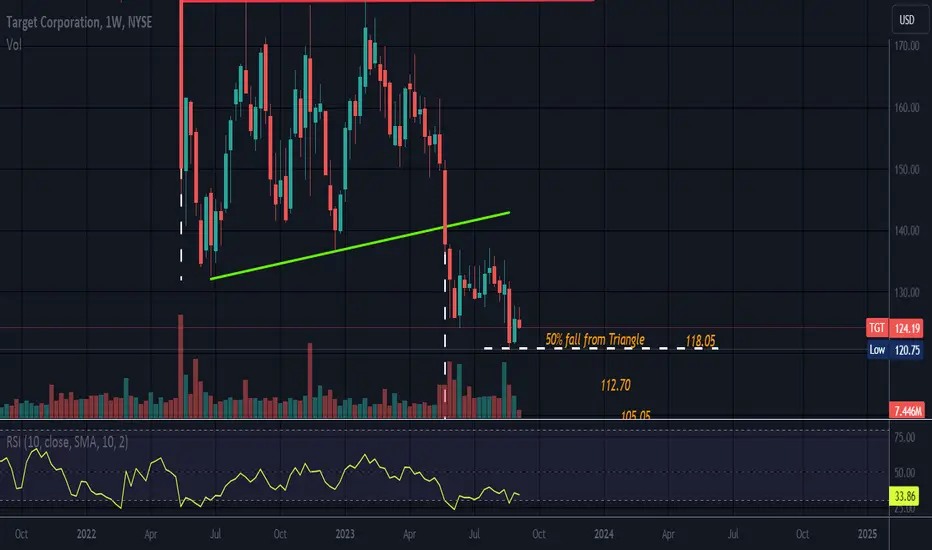
Looks like an Ascending Triangle o the weekly timeframe.
All triangles are neutral until broken. This Ascending Triangle has broken to the downside.
Targets in orange and were calculated using the wide end and fib levels.
Price has hit the 50% mark. The next target is the .618, then the .786 then 100%.
Price can fall less or more than 100%. T1 which was the .382 has been passed.
No recommendation.
If one does not see a pattern on daily, sometimes there is one on weekly.
The green line should be red as prior support is now resistance.
Wyłączenie odpowiedzialności
Informacje i publikacje nie stanowią i nie powinny być traktowane jako porady finansowe, inwestycyjne, tradingowe ani jakiekolwiek inne rekomendacje dostarczane lub zatwierdzone przez TradingView. Więcej informacji znajduje się w Warunkach użytkowania.
Wyłączenie odpowiedzialności
Informacje i publikacje nie stanowią i nie powinny być traktowane jako porady finansowe, inwestycyjne, tradingowe ani jakiekolwiek inne rekomendacje dostarczane lub zatwierdzone przez TradingView. Więcej informacji znajduje się w Warunkach użytkowania.