Shriram Transport Finance (D) - Head & Shoulders Chart Pattern
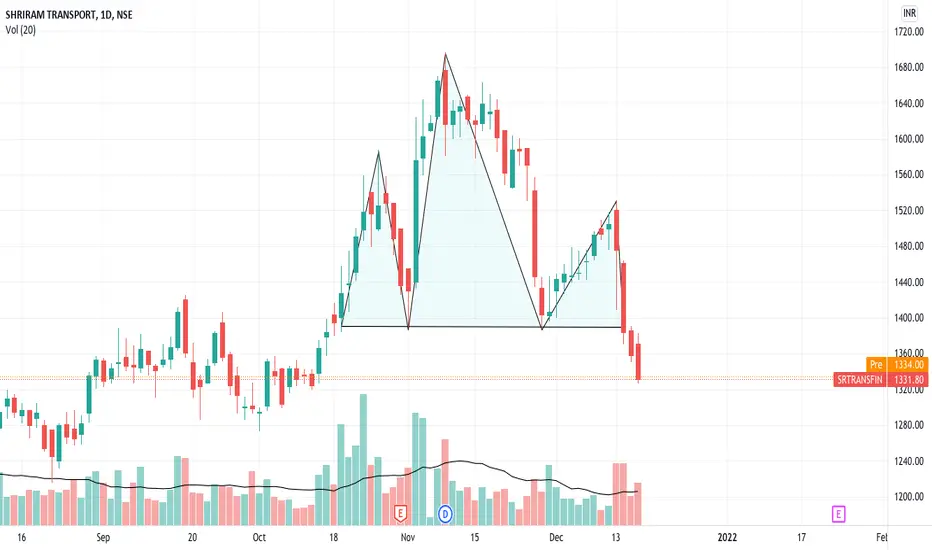
Shriram Transport Finance (Daily)
Head & Shoulders Chart Pattern
Lower bollinger band is challenged
MACD of the daily wave and weekly tide is downtick
RSI is below 40 in the oversold zone
Stochastic 14,3,3 is in negative crossover and oversold zone
-DI is above +DI and ADX is above 15 in the Directional Movement Index (DMI)
Seems to be in the C wave currently
Look for the next major support below on the chart as Target 1
Wyłączenie odpowiedzialności
Informacje i publikacje przygotowane przez TradingView lub jego użytkowników, prezentowane na tej stronie, nie stanowią rekomendacji ani porad handlowych, inwestycyjnych i finansowych i nie powinny być w ten sposób traktowane ani wykorzystywane. Więcej informacji na ten temat znajdziesz w naszym Regulaminie.