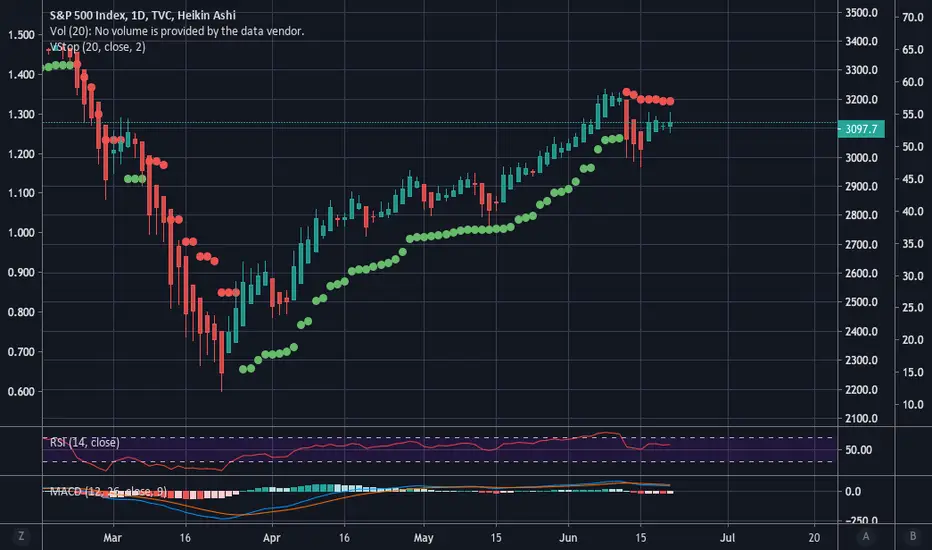
The daily chart using Heikin Ashi candles with volatility stops indicates that the trend changed to a downtrend last Thursday. A reasonable move back up would stop out these trending chart indicators, but they can be useful for longer-term trades. For instance, as you can see in the chart, had you traded off of these alone, you would have gone long on March 25th until last Thursday.
Wyłączenie odpowiedzialności
Informacje i publikacje przygotowane przez TradingView lub jego użytkowników, prezentowane na tej stronie, nie stanowią rekomendacji ani porad handlowych, inwestycyjnych i finansowych i nie powinny być w ten sposób traktowane ani wykorzystywane. Więcej informacji na ten temat znajdziesz w naszym Regulaminie.