Rocket Lab
 RKLB is showing a high-probability setup for a major run, supported by a bullish technical structure and strong underlying fundamentals.
Technical Perspective
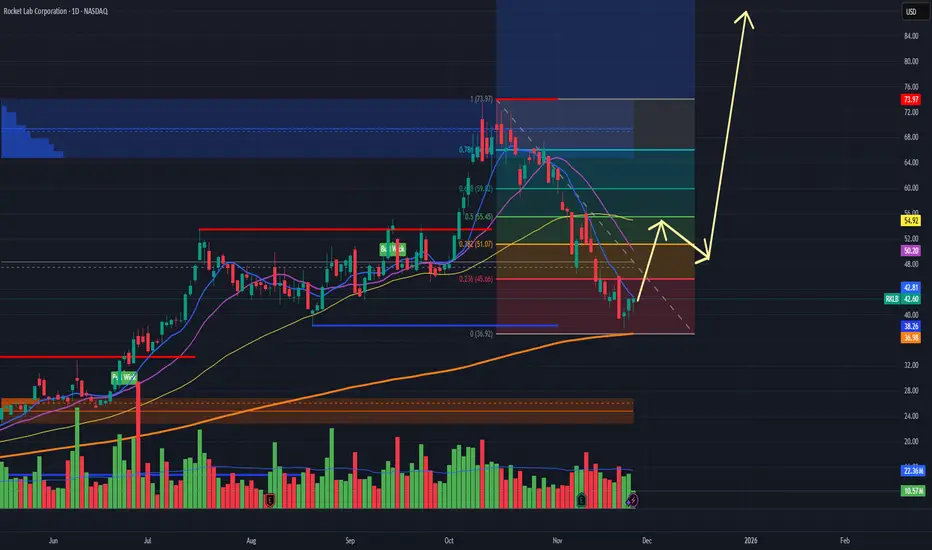
The daily chart reveals Rocket Lab has bounced off its recent lows near $36.90 on 200SMA, forming a potential bottom with climbing volume. Fibonacci retracement levels show key resistance around $51 and $54, and a breakout above these puts the $73 and $83 zones firmly in play. Price action is now holding above the rising 200-day moving average—often viewed as a strong support line—and the yellow arrows forecast a classic “ABC” recovery pattern targeting prior highs and new expansion zones.
Momentum and volume profiles back this thesis: the last few green bars suggest accumulation is underway, and the blue buy zone near $42.60 offers a defined risk entry. Such setups feature optimal reward/risk ratios for swing and position traders.
Fundamentals
Rocket Lab recently posted $155 million Q3 revenue, up 48% year-over-year, with improving gross margins and projections for record turnover next quarter. The company sports a healthy contract pipeline (including government/hypersonic deals), rapid satellite deployment, and consistent launch cadence—all signs of operational momentum.
Analysts now see upside targets between $55 and $83, driven by both revenue acceleration and vertical integration. Most importantly, Rocket Lab continues to narrow EBITDA losses, proof that its path to profitability is intact.
Why a Double Is Plausible
Technical setup favors a rally back toward the $80 level if supply at $54 is absorbed.
Growth rates far exceed sector averages; additional launches and government contracts can fuel a re-rating.
Accumulation on the chart supports a near-term reversal and multi-month breakout.
With momentum building and fundamentals supporting a much higher valuation, Rocket Lab is positioned to potentially double from current levels within the next rally cycle.
Technical Perspective
The daily chart reveals Rocket Lab has bounced off its recent lows near $36.90 on 200SMA, forming a potential bottom with climbing volume. Fibonacci retracement levels show key resistance around $51 and $54, and a breakout above these puts the $73 and $83 zones firmly in play. Price action is now holding above the rising 200-day moving average—often viewed as a strong support line—and the yellow arrows forecast a classic “ABC” recovery pattern targeting prior highs and new expansion zones.
Momentum and volume profiles back this thesis: the last few green bars suggest accumulation is underway, and the blue buy zone near $42.60 offers a defined risk entry. Such setups feature optimal reward/risk ratios for swing and position traders.
Fundamentals
Rocket Lab recently posted $155 million Q3 revenue, up 48% year-over-year, with improving gross margins and projections for record turnover next quarter. The company sports a healthy contract pipeline (including government/hypersonic deals), rapid satellite deployment, and consistent launch cadence—all signs of operational momentum.
Analysts now see upside targets between $55 and $83, driven by both revenue acceleration and vertical integration. Most importantly, Rocket Lab continues to narrow EBITDA losses, proof that its path to profitability is intact.
Why a Double Is Plausible
Technical setup favors a rally back toward the $80 level if supply at $54 is absorbed.
Growth rates far exceed sector averages; additional launches and government contracts can fuel a re-rating.
Accumulation on the chart supports a near-term reversal and multi-month breakout.
With momentum building and fundamentals supporting a much higher valuation, Rocket Lab is positioned to potentially double from current levels within the next rally cycle.
-warena
Wyłączenie odpowiedzialności
Informacje i publikacje nie stanowią i nie powinny być traktowane jako porady finansowe, inwestycyjne, tradingowe ani jakiekolwiek inne rekomendacje dostarczane lub zatwierdzone przez TradingView. Więcej informacji znajduje się w Warunkach użytkowania.
-warena
Wyłączenie odpowiedzialności
Informacje i publikacje nie stanowią i nie powinny być traktowane jako porady finansowe, inwestycyjne, tradingowe ani jakiekolwiek inne rekomendacje dostarczane lub zatwierdzone przez TradingView. Więcej informacji znajduje się w Warunkach użytkowania.