https://www.tradingview.com/x/xVJOxxVJ
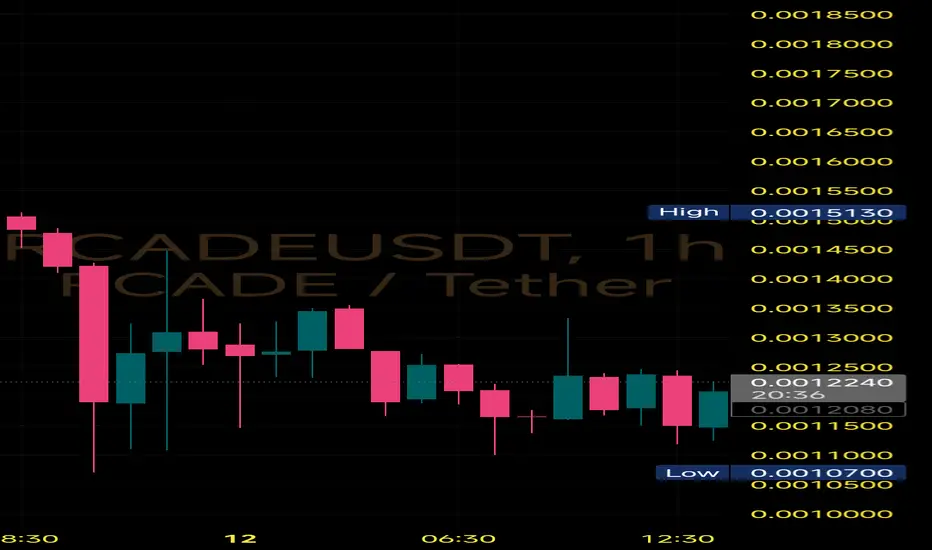
#RCADE is showing signs of a potential reversal on the 1Hr timeframe, forming a Double Bottom near the 0.00117 support zone.
🔹Bottom 1 and Bottom 2 are now clearly defined
🔹Neckline resistance at ~0.00145
🔹Current price hovering around 0.00122
Bullish only if -
A breakout and close above 0.00145 with volume = confirmation of reversal
Target zone = 0.00160–0.00170
Breakdown below 0.00117 would invalidate the double bottom setup
⏳ Price is compressing—watch for breakout attempts soon.
Wyłączenie odpowiedzialności
Informacje i publikacje przygotowane przez TradingView lub jego użytkowników, prezentowane na tej stronie, nie stanowią rekomendacji ani porad handlowych, inwestycyjnych i finansowych i nie powinny być w ten sposób traktowane ani wykorzystywane. Więcej informacji na ten temat znajdziesz w naszym Regulaminie.