https://www.tradingview.com/x/mFwswPSt
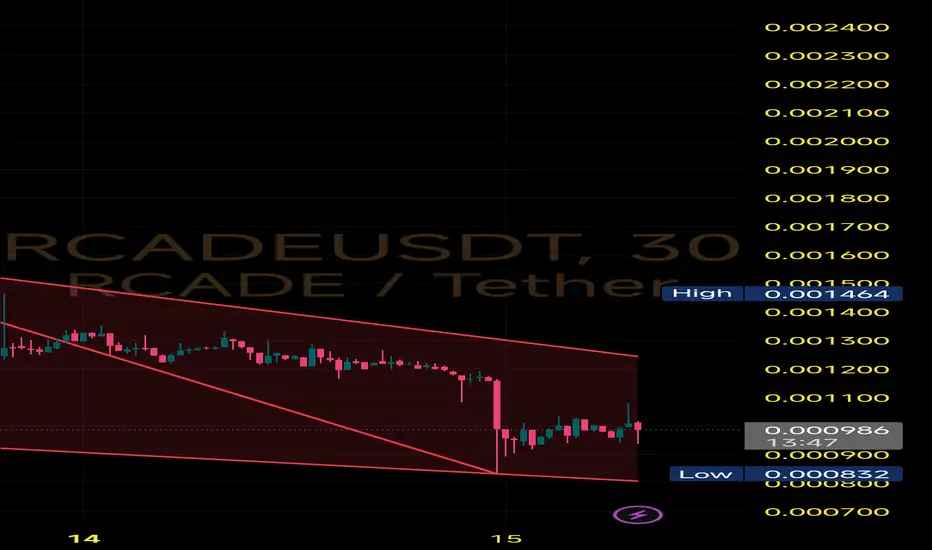
A falling wedge is formed when price makes lower highs and lower lows within converging trendlines. It’s typically a bullish pattern, especially after an extended downtrend like this one.
Current Situation - Price touched the lower wedge boundary at $0.000832 (latest local low)
Multiple taps on both support and resistance trendlines confirm wedge validity
Quick rebound from the wedge bottom hints that buyers are stepping in
🔹Breakout zone above $0.00110–$0.00115 could trigger rapid move
🔸Immediate resistance levels: $0.00130 → $0.00150 → $0.00180
⚠️ Invalidation:
A breakdown below $0.00083 with high volume would invalidate the wedge and resume the downtrend.
Wyłączenie odpowiedzialności
Informacje i publikacje przygotowane przez TradingView lub jego użytkowników, prezentowane na tej stronie, nie stanowią rekomendacji ani porad handlowych, inwestycyjnych i finansowych i nie powinny być w ten sposób traktowane ani wykorzystywane. Więcej informacji na ten temat znajdziesz w naszym Regulaminie.