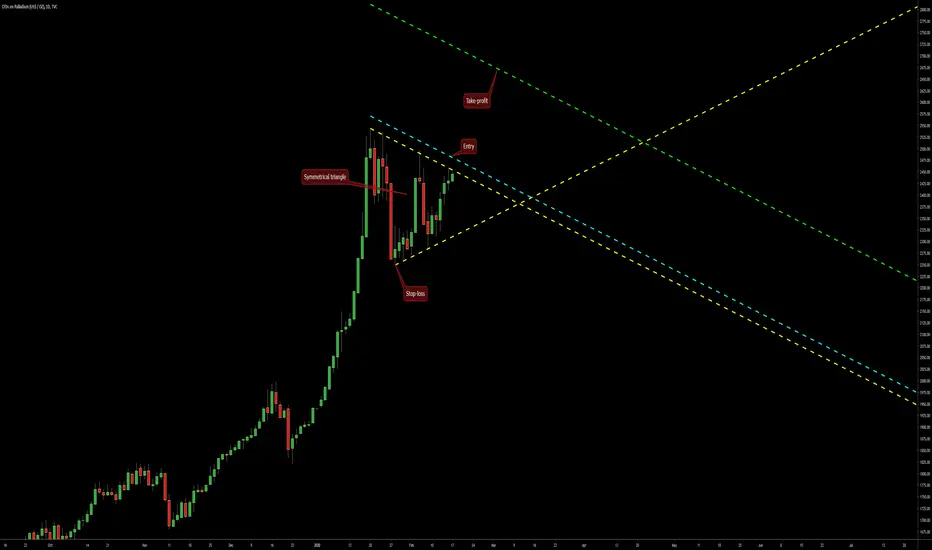
The symmetrical triangle on this daily chart of Palladium CFD offers an upside breakout trading opportunity. The triangle's borders are drawn using the yellow lines. My potential entry level will be at the cyan line. My potential take-profit level will be at the green line. I will use the low of the triangle's base as my stop-loss level (2249.0).
Wyłączenie odpowiedzialności
Informacje i publikacje nie stanowią i nie powinny być traktowane jako porady finansowe, inwestycyjne, tradingowe ani jakiekolwiek inne rekomendacje dostarczane lub zatwierdzone przez TradingView. Więcej informacji znajduje się w Warunkach użytkowania.
Wyłączenie odpowiedzialności
Informacje i publikacje nie stanowią i nie powinny być traktowane jako porady finansowe, inwestycyjne, tradingowe ani jakiekolwiek inne rekomendacje dostarczane lub zatwierdzone przez TradingView. Więcej informacji znajduje się w Warunkach użytkowania.