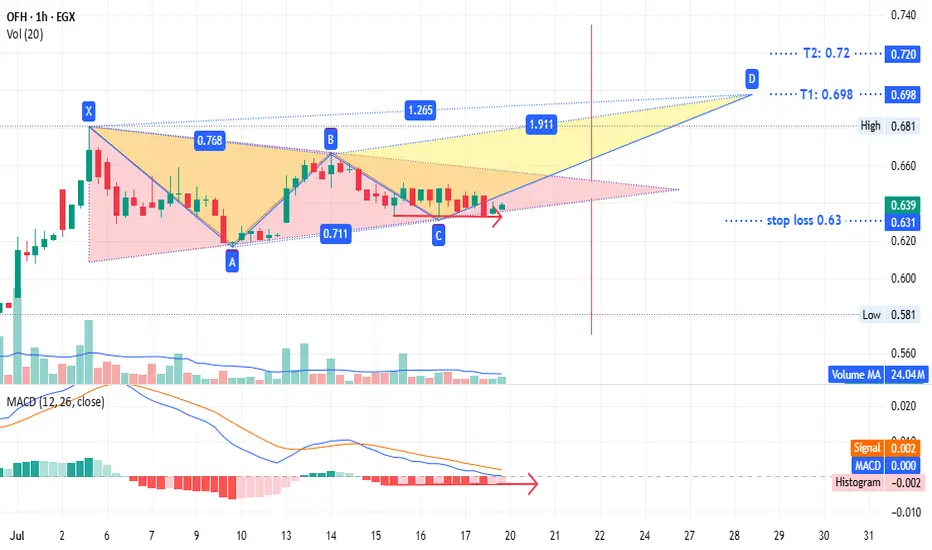
showing a potential triangle pattern with targets at
0.72 if prices close above the upper line or
0.57 if they close below the lower line.
Alternatively, a bearish pattern could target 0.698 to 0.72.
The stop loss is set at 0.63 to 0.624 (the gap from July 13) based on your strategy.
A long position here offers low risk (2% loss vs. ~10% profit potential).
This is not investment advice—only my chart analysis. Consult your account manager before investing. Good luck.
Uwaga
The triangle pattern is confirmed; the target is now 0.72 for a new high. Good luck.Zlecenie aktywne
amazing all targets achieved
last target at 0.735
if prices closed over 0.745 rebuy what you sell
good luck
Transakcja zamknięta: osiągnięto wyznaczony cel
all targets achieved for all patterns now we have a bearish pattern sell around 0.72
rebuy if prices closed over 0.745
T1: 0.695
T2: 0.665
This is not investment advice—only my chart analysis. Consult your account manager before investing. Good luck.
Wyłączenie odpowiedzialności
Informacje i publikacje przygotowane przez TradingView lub jego użytkowników, prezentowane na tej stronie, nie stanowią rekomendacji ani porad handlowych, inwestycyjnych i finansowych i nie powinny być w ten sposób traktowane ani wykorzystywane. Więcej informacji na ten temat znajdziesz w naszym Regulaminie.