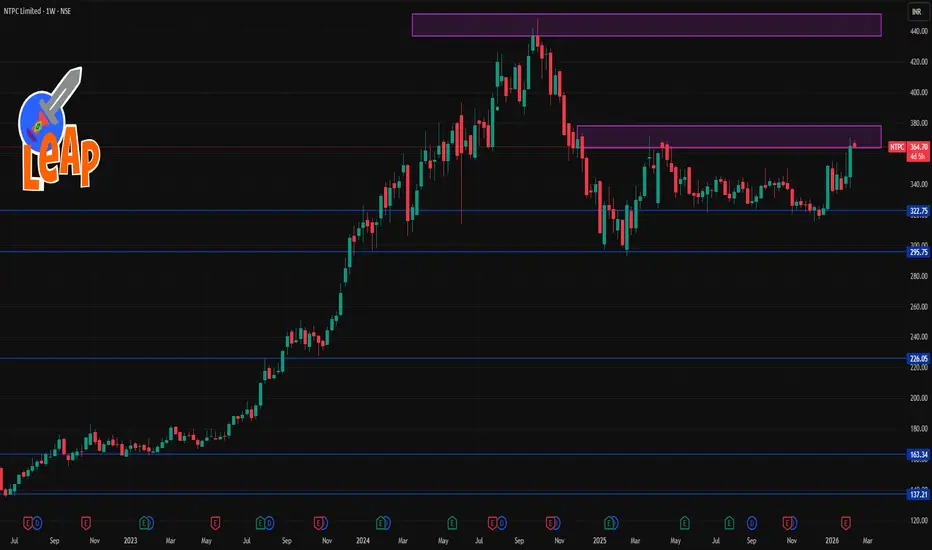
📊 Current Approx Price Range
• Trading near ₹365–₹370 on the NSE this week.
📈 Weekly Resistance Levels (Upside)
• R1: ~₹378 – first reaction resistance this week
• R2: ~₹390 – secondary hurdle before fresh upside
• R3: ~₹410 – extended resistance if bulls dominate
• Fibonacci/Weekly Pivot R2–R3: ~₹390–₹411 area
📉 Weekly Support Levels (Downside)
• S1: ~₹345 – first major weekly support zone
• S2: ~₹325 – deeper support if S1 breaks
• S3: ~₹312 – last weekly structure support
• Weekly Pivot/Fib S1 area: ~₹324–₹345
📌 Weekly Pivot Approx Levels (from pivot calculations)
• Standard weekly pivots place pivot ~₹357–₹358, with support/resistance branching around it.
📊 Technical Signals (Weekly)
• Some platforms show a bullish/“strong buy” bias based on weekly indicators (moving averages & oscillators) — suggesting the trend is currently positive if the price holds above key supports.
Quick summary:
➡️ Bullish week if NTPC holds above ₹345 and breaks above ₹378–₹390.
➡️ Bearish pressure if weekly close slips below ₹345 → ₹325 → ₹312.
Powiązane publikacje
Wyłączenie odpowiedzialności
Informacje i publikacje nie stanowią i nie powinny być traktowane jako porady finansowe, inwestycyjne, tradingowe ani jakiekolwiek inne rekomendacje dostarczane lub zatwierdzone przez TradingView. Więcej informacji znajduje się w Warunkach użytkowania.