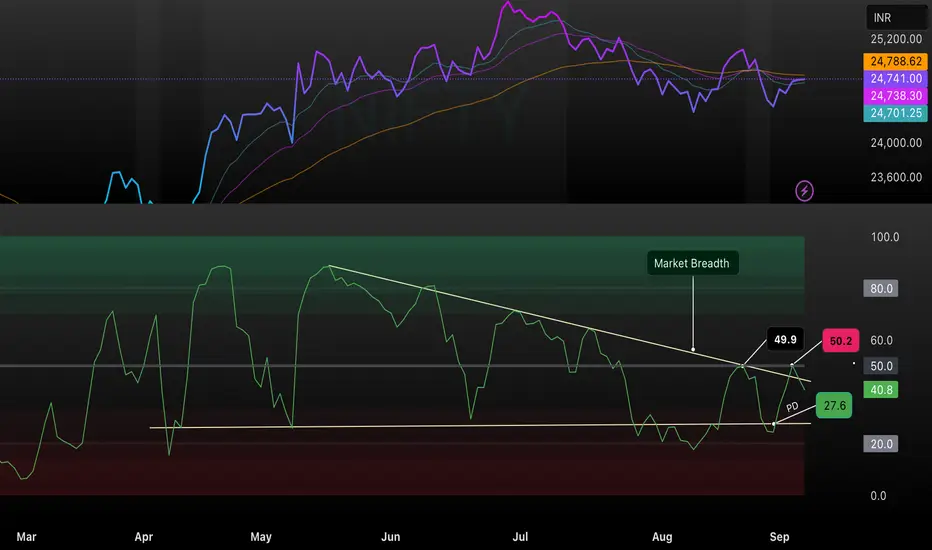
This chart highlights the recent shift in Nifty market breadth, signaling a possible trend reversal as the momentum indicator crosses above the key resistance trendline near 49.9. It combines relative price action (with moving averages) and market breadth metrics to illustrate how participation within the index is evolving after sustained periods of weakness. The annotated regions show critical support and resistance levels (50.2, 40.8, 27.6) and mark the latest signal points, helping traders spot emerging opportunities and risks during the transition phase in September 2025.
This concise format helps community members quickly grasp the chart’s relevance, aligns with technical analysis focus, and supports trading discussions.
This concise format helps community members quickly grasp the chart’s relevance, aligns with technical analysis focus, and supports trading discussions.
Wyłączenie odpowiedzialności
Informacje i publikacje przygotowane przez TradingView lub jego użytkowników, prezentowane na tej stronie, nie stanowią rekomendacji ani porad handlowych, inwestycyjnych i finansowych i nie powinny być w ten sposób traktowane ani wykorzystywane. Więcej informacji na ten temat znajdziesz w naszym Regulaminie.