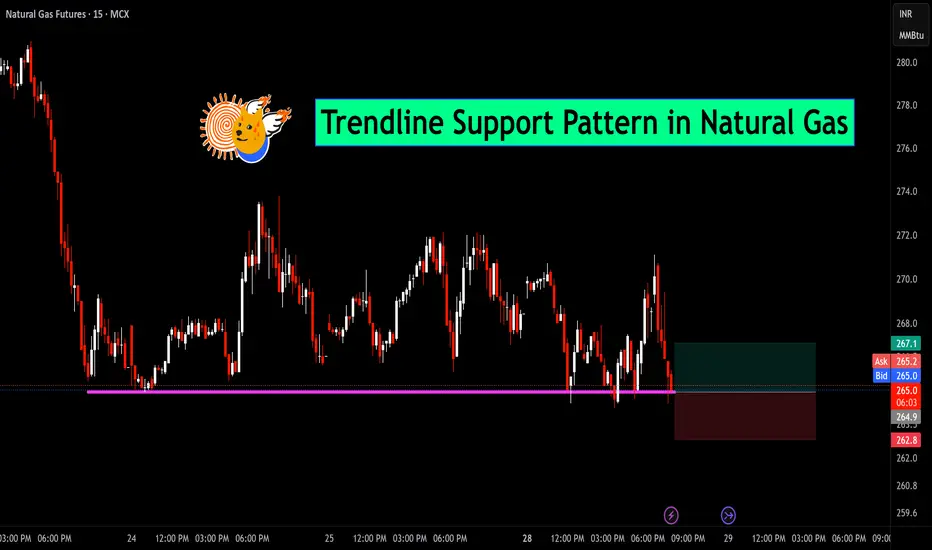
Natural Gas is currently respecting a well-established horizontal trendline support zone around the 264–265 level. As seen in the chart, price has tested this area multiple times, indicating strong demand and buyer interest at this zone.
📉 The recent candles show rejection from the support, suggesting a potential bounce. If this level continues to hold, we may see an upward move toward the 267–270 resistance area.
📌 Trade Idea:
Entry: Near 265.3
Stop-loss: Below 262.8 (structure break)
Target: 267.1 and above for short-term move
🧠 Watch for confirmation with volume or bullish candlestick formations before entering the trade.
Get BTST Toolkit:
Contact below to get access ⬇️
✅Whatsapp: wa.me/919084286797
✅ Telegram: t.me/breakoutinvesting
⭐ Custom Indicator
⭐ BTST Calls
⭐ FNO Trades
⭐ Algo Trading
Contact below to get access ⬇️
✅Whatsapp: wa.me/919084286797
✅ Telegram: t.me/breakoutinvesting
⭐ Custom Indicator
⭐ BTST Calls
⭐ FNO Trades
⭐ Algo Trading
Wyłączenie odpowiedzialności
Informacje i publikacje nie stanowią i nie powinny być traktowane jako porady finansowe, inwestycyjne, tradingowe ani jakiekolwiek inne rekomendacje dostarczane lub zatwierdzone przez TradingView. Więcej informacji znajduje się w Warunkach użytkowania.