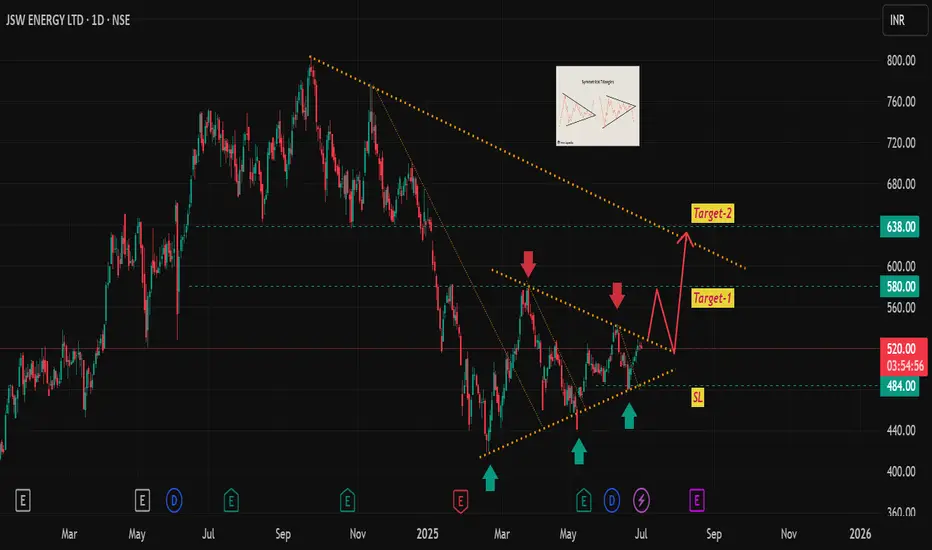
JSW Energy - under the formation of symmetric triangle chart pattern, it is near to breakout level, one can go long (short term) here, stop loss and targets are mentioned in the chart.
Please note: I am not a certified stock analyst, this chart is purely for education purpose, request you to do your own financial assessment before investment/trade.
Please note: I am not a certified stock analyst, this chart is purely for education purpose, request you to do your own financial assessment before investment/trade.
Wyłączenie odpowiedzialności
Informacje i publikacje nie stanowią i nie powinny być traktowane jako porady finansowe, inwestycyjne, tradingowe ani jakiekolwiek inne rekomendacje dostarczane lub zatwierdzone przez TradingView. Więcej informacji znajduje się w Warunkach użytkowania.
Wyłączenie odpowiedzialności
Informacje i publikacje nie stanowią i nie powinny być traktowane jako porady finansowe, inwestycyjne, tradingowe ani jakiekolwiek inne rekomendacje dostarczane lub zatwierdzone przez TradingView. Więcej informacji znajduje się w Warunkach użytkowania.
