JPM Technical Outlook – Range-Bound Between Support & Resistance
🏦 JPM Technical Outlook – Range-Bound Between Support & Resistance
Ticker: JPM (JPMorgan Chase & Co.)
Timeframe: 30-minute candles
🔍 Current Setup
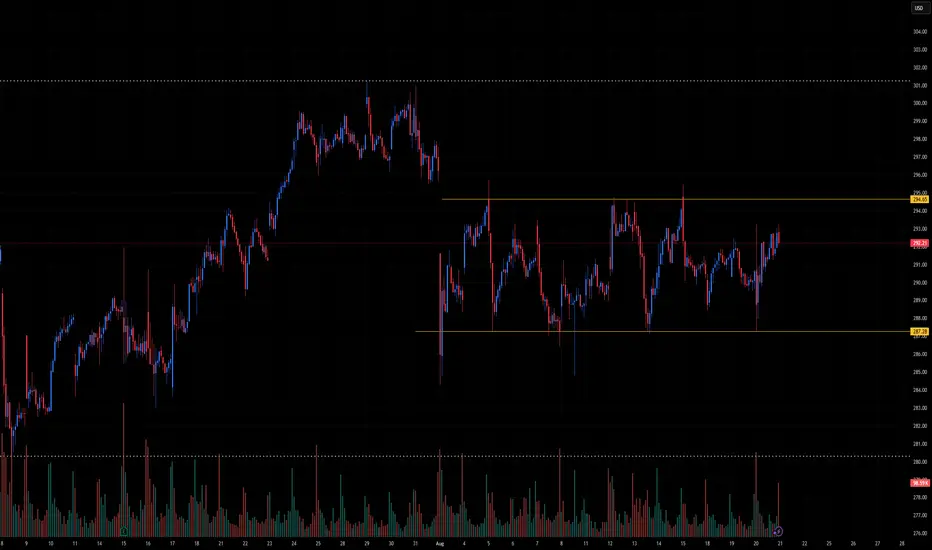
JPM has been trading inside a horizontal range for several weeks, with price repeatedly rejecting both resistance and support.
Range Resistance: ~295.00
Range Support: ~287.20
Current price: ~292.20, sitting near the mid-range.
This structure signals consolidation after prior gains, with traders waiting for a breakout to set the next directional move.
📊 Breakout Levels
🚀 Upside (Bullish Scenario)
Trigger: Break and close above 295.00.
Intermediate Targets:
298.00–300.00 → Round-number psychological resistance.
302.00 → Prior high.
Measured Move Target: ~303–305 (range height projection).
🔻 Downside (Bearish Scenario)
Trigger: Break and close below 287.20.
Intermediate Supports:
285.00 → Minor support.
281.50–282.00 → Previous demand zone.
Measured Move Target: ~279.00 (range height projection).
📈 Volume Analysis
Volume has been declining during the chop, consistent with range-bound trading.
Expect volume expansion on breakout, confirming the move’s legitimacy.
⚖️ Probability Bias
JPM remains neutral until it leaves the 287–295 range.
A break above 295 would favor bulls, targeting 300+.
A drop below 287 would favor bears, aiming for 282 → 279.
✅ Takeaway
JPM is stuck in a tight consolidation range:
Bullish Break > 295: Targets 298 → 300 → 303–305
Bearish Break < 287: Targets 285 → 282 → 279
Until then, expect continued sideways chop between the range boundaries.
Ticker: JPM (JPMorgan Chase & Co.)
Timeframe: 30-minute candles
🔍 Current Setup
JPM has been trading inside a horizontal range for several weeks, with price repeatedly rejecting both resistance and support.
Range Resistance: ~295.00
Range Support: ~287.20
Current price: ~292.20, sitting near the mid-range.
This structure signals consolidation after prior gains, with traders waiting for a breakout to set the next directional move.
📊 Breakout Levels
🚀 Upside (Bullish Scenario)
Trigger: Break and close above 295.00.
Intermediate Targets:
298.00–300.00 → Round-number psychological resistance.
302.00 → Prior high.
Measured Move Target: ~303–305 (range height projection).
🔻 Downside (Bearish Scenario)
Trigger: Break and close below 287.20.
Intermediate Supports:
285.00 → Minor support.
281.50–282.00 → Previous demand zone.
Measured Move Target: ~279.00 (range height projection).
📈 Volume Analysis
Volume has been declining during the chop, consistent with range-bound trading.
Expect volume expansion on breakout, confirming the move’s legitimacy.
⚖️ Probability Bias
JPM remains neutral until it leaves the 287–295 range.
A break above 295 would favor bulls, targeting 300+.
A drop below 287 would favor bears, aiming for 282 → 279.
✅ Takeaway
JPM is stuck in a tight consolidation range:
Bullish Break > 295: Targets 298 → 300 → 303–305
Bearish Break < 287: Targets 285 → 282 → 279
Until then, expect continued sideways chop between the range boundaries.
Zlecenie aktywne
BREAKOUT LED TO ALL TIME HIGHSWyłączenie odpowiedzialności
Informacje i publikacje nie stanowią i nie powinny być traktowane jako porady finansowe, inwestycyjne, tradingowe ani jakiekolwiek inne rekomendacje dostarczane lub zatwierdzone przez TradingView. Więcej informacji znajduje się w Warunkach użytkowania.
Wyłączenie odpowiedzialności
Informacje i publikacje nie stanowią i nie powinny być traktowane jako porady finansowe, inwestycyjne, tradingowe ani jakiekolwiek inne rekomendacje dostarczane lub zatwierdzone przez TradingView. Więcej informacji znajduje się w Warunkach użytkowania.