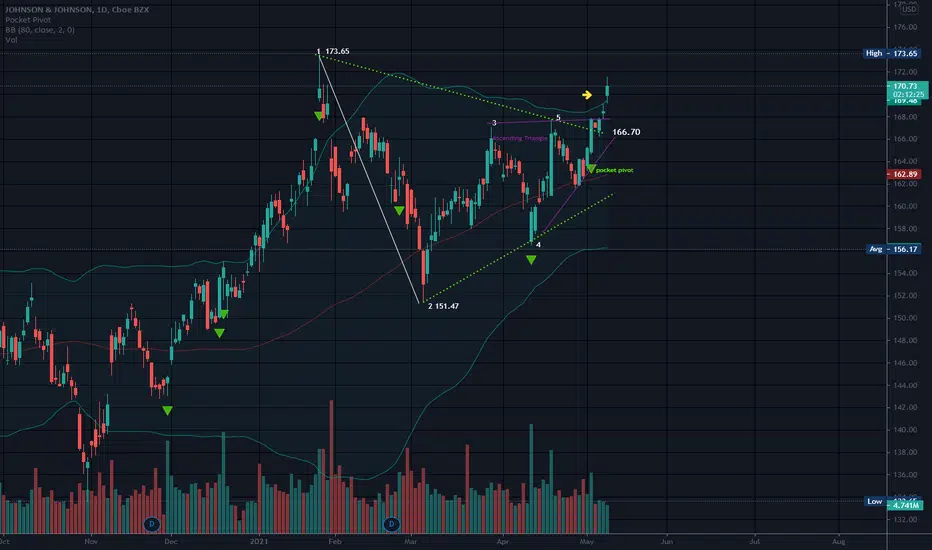
173.65 is the long term high.
JNJ has broken free of both triangles, as well as the bollinger bands.
Bollinger bands are set on this chart using an eighty day moving average verses the norm of 20. Price is above the top band today which is bullish, but it is likely that price will return to the inside of the bands.
No recommendation
Wyłączenie odpowiedzialności
Informacje i publikacje przygotowane przez TradingView lub jego użytkowników, prezentowane na tej stronie, nie stanowią rekomendacji ani porad handlowych, inwestycyjnych i finansowych i nie powinny być w ten sposób traktowane ani wykorzystywane. Więcej informacji na ten temat znajdziesz w naszym Regulaminie.