🔎 Current Snapshot
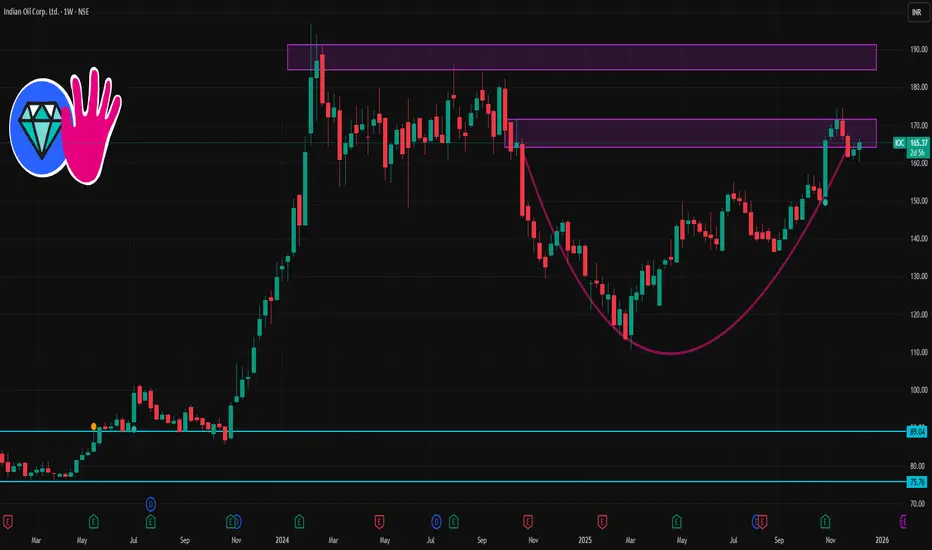
Latest price on NSE: ~ ₹163.00–₹163.50.
52‑week trading range: ₹110.72 (low) ⇒ ₹174.50 (high).
On moving averages: price is above 50‑day, 100‑day and 200‑day MA — a bullish structural sign, though short‑term oscillators are mixed/neutral.
Recent 1‑week performance: modest gains (price near upper of recent short‑term range) — suggests a cautious bullish bias, not a runaway rally.
✅ My “Base‑Case” 1‑Week Scenarios
Scenario A – Mild Bullish (likely): Price hovers between ₹160–165, bouncing off support ~₹160 and possibly testing ₹165–166.
Scenario B – Bullish Breakout (if catalysts align): Break above ₹165–166 → move toward ₹167–168 (maybe touching ₹170).
Scenario C – Weak/Neutral (in adverse market): If oil/market turns negative & price breaks below ₹160, watch for dips toward ₹158–159.
Powiązane publikacje
Wyłączenie odpowiedzialności
Informacje i publikacje nie stanowią i nie powinny być traktowane jako porady finansowe, inwestycyjne, tradingowe ani jakiekolwiek inne rekomendacje dostarczane lub zatwierdzone przez TradingView. Więcej informacji znajduje się w Warunkach użytkowania.