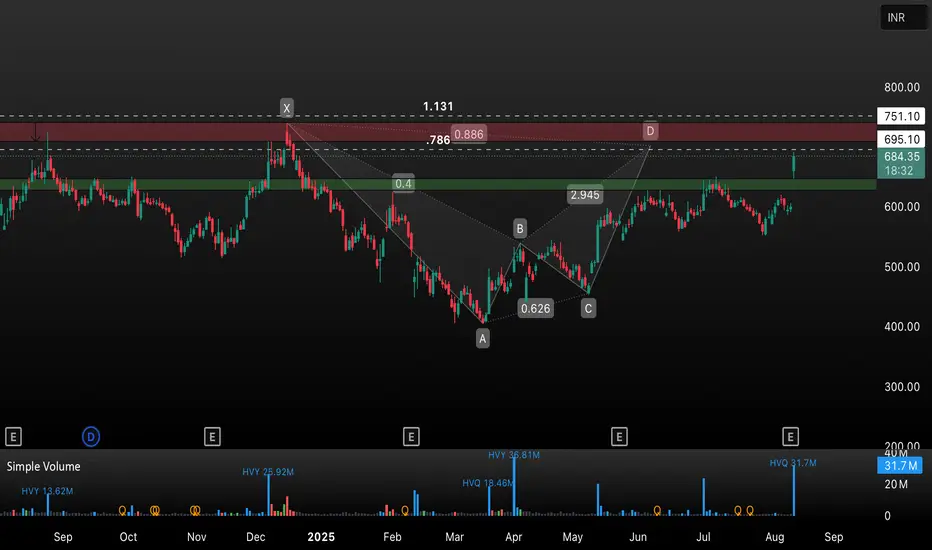
HB LENG has demonstrated a strong bullish breakout, surging over 13% and breaking past previous resistance. The chart displays a completed harmonic pattern with the price moving towards the D point zone (751 level). Key resistance lies between 695 – 751, with Fibonacci levels (.786/.886) as potential reversal zones.
Trade Insight:
• Support: 620–695 (green zone)
• Resistance: 695–751 (red zone)
• Watch for price action near the 751 zone; a breakout could trigger a fresh uptrend, while rejection may see consolidation or pullback.
• High volume confirms strong buyer interest.
Strategy:
Consider booking partial profits as price approaches resistance. Wait for confirmation before entering new positions. Ideal for swing traders watching for breakout or reversal signs.
Wyłączenie odpowiedzialności
Informacje i publikacje przygotowane przez TradingView lub jego użytkowników, prezentowane na tej stronie, nie stanowią rekomendacji ani porad handlowych, inwestycyjnych i finansowych i nie powinny być w ten sposób traktowane ani wykorzystywane. Więcej informacji na ten temat znajdziesz w naszym Regulaminie.