Readers have likely noticed the early September breakout clocked by Google parent Alphabet  GOOGL , which hit an all-time intraday high this week. Can the stock's nearly 15% run so far this month continue? Let's see what technical and fundamental analysis says.
Alphabet's Fundamental Analysis
GOOGL has risen 13.9% over September's first eight sessions to hit a $242.25 intraday record high on Thursday.
Most of Alphabet's September gains came on Sept. 3, when the stock popped 9.1% after a federal judge overseeing the U.S. government's antitrust case against AlphabetGOOG ruled that the firm doesn't have to sell off the Google search engine.
The court also said Google and Apple can retain a contract under which AAPL pre-loads Google's search engine onto iPhones in exchange for big payments from Alphabet.
GOOGL has risen another roughly 5% since then even though the company is still some six weeks out from its next earnings release.
Of the 45 sell-side analysts that I know of that cover the stock, 36 have revised their earnings estimates higher since the quarter began, while three have lowered their numbers. (The other six have so far left their earnings estimates unchanged.)
Alphabet's Technical Analysis
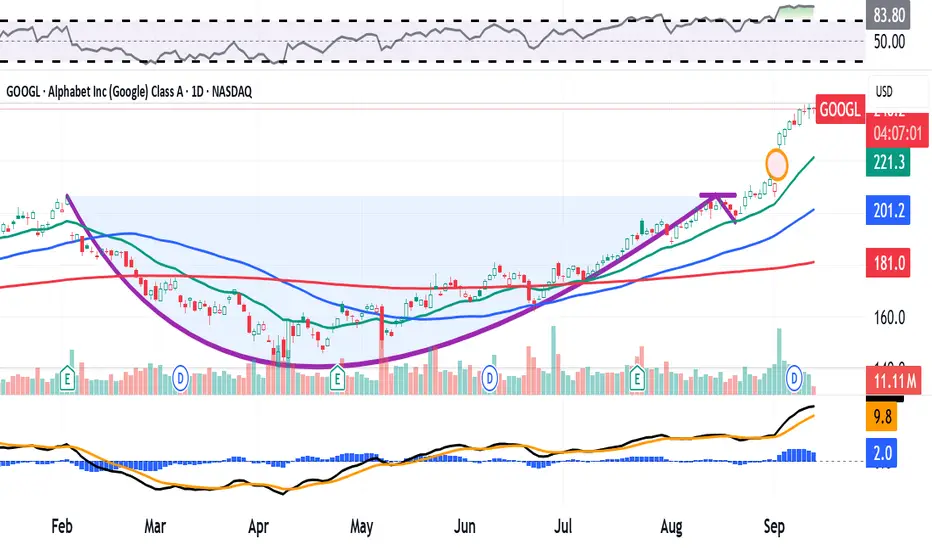
Now let's get down to business and take a look at GOOGL's technical breakout, as shown here in the stock's year-to-date chart through midday Tuesday:

Readers will see that from late January into August, GOOGL developed a bullish "cup-with-handle" pattern that looks like it came out of a textbook.
Marked with a purple curving line in the chart above, this pattern has a $206 pivot.
For those new to technical analysis, a cup pattern's pivot is the apex of the cup's left side. Once a handle is added, that pivot moves across to the right-side peak.
While I think that GOOGL could in theory move higher from here, I do have some concerns that are starting to nag at me.
For starters, the stock created a still-unfilled gap on the morning of Sept. 3, as denoted by the orange circle at the chart's right above. Such unfilled gaps don't have to be filled, but they often are.
That said, Alphabet's bullish technical set-up remains in place in the chart above. However, it does look like the stock's recent price surge was starting to top off in the high $230s and low $240s as I wrote this Thursday afternoon.
Meanwhile, GOOGL's Relative Strength Index (the gray line at the chart's top) is beyond merely extended. While that's a good problem for Alphabet bulls to have, it's the result of the stock's recent parabolic move and reflects a technically overbought condition.
Similarly, readers will see that Alphabet's daily Moving Average Convergence Divergence indicator (or "MACD," marked with black and gold lines and blue bars at the chart's bottom) is postured in a seemingly bullish way.
The histogram of the stock's 9-day EMA (the blue bars) is now significantly positive and has been for a number of days.
Alphabet's 12-day EMA (black line) is also well into positive territory and has crossed well above the 26-day EMA (gold line). That's also typically a bullish technical signal.
All in, GOOGL was trading at a roughly 20% premium to its 50-day Simple Moving Average (or "SMA," marked with a blue line above) and a whopping 31% premium to its 200-day SMA (the red line) as of Thursday afternoon. That's all somewhat concerning technically.
An Options Option
How might someone try to protect themselves if they're long the stock?
Consider purchasing a "protected collar."
First, buy puts that expire later than Alphabet's next expected earnings date -- say, a contract with an Oct. 24 expiration date.
The person would pay for those puts (or at least subsidize their purchase) by selling an equal-sized covered call against their long position.
Such a set-up would create a possible escape for an investor for a reduced cost through the sale of some potential excess gains.
(Moomoo Technologies Inc. Markets Commentator Stephen “Sarge” Guilfoyle was long GOOGL at the time of writing this column.)
This article discusses technical analysis, other approaches, including fundamental analysis, may offer very different views. The examples provided are for illustrative purposes only and are not intended to be reflective of the results you can expect to achieve. Specific security charts used are for illustrative purposes only and are not a recommendation, offer to sell, or a solicitation of an offer to buy any security. Past investment performance does not indicate or guarantee future success. Returns will vary, and all investments carry risks, including loss of principal. This content is also not a research report and is not intended to serve as the basis for any investment decision. The information contained in this article does not purport to be a complete description of the securities, markets, or developments referred to in this material. Moomoo and its affiliates make no representation or warranty as to the article's adequacy, completeness, accuracy or timeliness for any particular purpose of the above content. Furthermore, there is no guarantee that any statements, estimates, price targets, opinions or forecasts provided herein will prove to be correct.
Options trading is risky and not appropriate for everyone. Read the Options Disclosure Document (https://j.moomoo.com/017y9J) before trading. Options are complex and you may quickly lose the entire investment. Supporting docs for any claims will be furnished upon request.
Moomoo is a financial information and trading app offered by Moomoo Technologies Inc. In the U.S., investment products and services on Moomoo are offered by Moomoo Financial Inc., Member FINRA/SIPC.
TradingView is an independent third party not affiliated with Moomoo Financial Inc., Moomoo Technologies Inc., or its affiliates. Moomoo Financial Inc. and its affiliates do not endorse, represent or warrant the completeness and accuracy of the data and information available on the TradingView platform and are not responsible for any services provided by the third-party platform.
Alphabet's Fundamental Analysis
GOOGL has risen 13.9% over September's first eight sessions to hit a $242.25 intraday record high on Thursday.
Most of Alphabet's September gains came on Sept. 3, when the stock popped 9.1% after a federal judge overseeing the U.S. government's antitrust case against Alphabet
The court also said Google and Apple can retain a contract under which AAPL pre-loads Google's search engine onto iPhones in exchange for big payments from Alphabet.
GOOGL has risen another roughly 5% since then even though the company is still some six weeks out from its next earnings release.
Of the 45 sell-side analysts that I know of that cover the stock, 36 have revised their earnings estimates higher since the quarter began, while three have lowered their numbers. (The other six have so far left their earnings estimates unchanged.)
Alphabet's Technical Analysis
Now let's get down to business and take a look at GOOGL's technical breakout, as shown here in the stock's year-to-date chart through midday Tuesday:
Readers will see that from late January into August, GOOGL developed a bullish "cup-with-handle" pattern that looks like it came out of a textbook.
Marked with a purple curving line in the chart above, this pattern has a $206 pivot.
For those new to technical analysis, a cup pattern's pivot is the apex of the cup's left side. Once a handle is added, that pivot moves across to the right-side peak.
While I think that GOOGL could in theory move higher from here, I do have some concerns that are starting to nag at me.
For starters, the stock created a still-unfilled gap on the morning of Sept. 3, as denoted by the orange circle at the chart's right above. Such unfilled gaps don't have to be filled, but they often are.
That said, Alphabet's bullish technical set-up remains in place in the chart above. However, it does look like the stock's recent price surge was starting to top off in the high $230s and low $240s as I wrote this Thursday afternoon.
Meanwhile, GOOGL's Relative Strength Index (the gray line at the chart's top) is beyond merely extended. While that's a good problem for Alphabet bulls to have, it's the result of the stock's recent parabolic move and reflects a technically overbought condition.
Similarly, readers will see that Alphabet's daily Moving Average Convergence Divergence indicator (or "MACD," marked with black and gold lines and blue bars at the chart's bottom) is postured in a seemingly bullish way.
The histogram of the stock's 9-day EMA (the blue bars) is now significantly positive and has been for a number of days.
Alphabet's 12-day EMA (black line) is also well into positive territory and has crossed well above the 26-day EMA (gold line). That's also typically a bullish technical signal.
All in, GOOGL was trading at a roughly 20% premium to its 50-day Simple Moving Average (or "SMA," marked with a blue line above) and a whopping 31% premium to its 200-day SMA (the red line) as of Thursday afternoon. That's all somewhat concerning technically.
An Options Option
How might someone try to protect themselves if they're long the stock?
Consider purchasing a "protected collar."
First, buy puts that expire later than Alphabet's next expected earnings date -- say, a contract with an Oct. 24 expiration date.
The person would pay for those puts (or at least subsidize their purchase) by selling an equal-sized covered call against their long position.
Such a set-up would create a possible escape for an investor for a reduced cost through the sale of some potential excess gains.
(Moomoo Technologies Inc. Markets Commentator Stephen “Sarge” Guilfoyle was long GOOGL at the time of writing this column.)
This article discusses technical analysis, other approaches, including fundamental analysis, may offer very different views. The examples provided are for illustrative purposes only and are not intended to be reflective of the results you can expect to achieve. Specific security charts used are for illustrative purposes only and are not a recommendation, offer to sell, or a solicitation of an offer to buy any security. Past investment performance does not indicate or guarantee future success. Returns will vary, and all investments carry risks, including loss of principal. This content is also not a research report and is not intended to serve as the basis for any investment decision. The information contained in this article does not purport to be a complete description of the securities, markets, or developments referred to in this material. Moomoo and its affiliates make no representation or warranty as to the article's adequacy, completeness, accuracy or timeliness for any particular purpose of the above content. Furthermore, there is no guarantee that any statements, estimates, price targets, opinions or forecasts provided herein will prove to be correct.
Options trading is risky and not appropriate for everyone. Read the Options Disclosure Document (https://j.moomoo.com/017y9J) before trading. Options are complex and you may quickly lose the entire investment. Supporting docs for any claims will be furnished upon request.
Moomoo is a financial information and trading app offered by Moomoo Technologies Inc. In the U.S., investment products and services on Moomoo are offered by Moomoo Financial Inc., Member FINRA/SIPC.
TradingView is an independent third party not affiliated with Moomoo Financial Inc., Moomoo Technologies Inc., or its affiliates. Moomoo Financial Inc. and its affiliates do not endorse, represent or warrant the completeness and accuracy of the data and information available on the TradingView platform and are not responsible for any services provided by the third-party platform.
Wyłączenie odpowiedzialności
Informacje i publikacje przygotowane przez TradingView lub jego użytkowników, prezentowane na tej stronie, nie stanowią rekomendacji ani porad handlowych, inwestycyjnych i finansowych i nie powinny być w ten sposób traktowane ani wykorzystywane. Więcej informacji na ten temat znajdziesz w naszym Regulaminie.