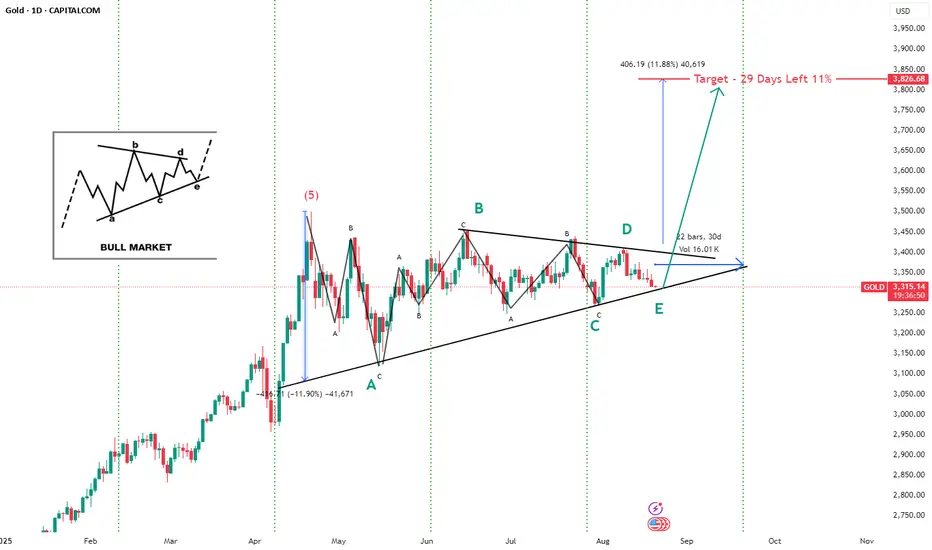
Pattern: The chart shows a Bullish Symmetrical Triangle (ABCDE structure) after a 5-wave rally.
Wave Count: Labeled as A–B–C–D–E consolidation within converging trendlines.
Current Position: Price is near point E, suggesting the triangle is close to completion.
Projection: A bullish breakout is expected after wave E.
Target:
Price: ~3,826.68 USD
Gain: +406.19 points (+11.88%)
Timeframe: ~29 days remaining (projection into September).
Volume: Moderate (~15.74K) during consolidation.
Technical Context:
Left inset shows a Bull Market triangle breakout schematic, indicating this setup aligns with a bullish continuation pattern.
The April correction (-11.9%) reset the trend, followed by the ongoing consolidation.
📌 Conclusion: Gold is forming a bullish continuation triangle and may rally ~11% toward 3,826 if the breakout occurs within the projected timeframe (about a month).
Technical Analyst BY Passion
Wyłączenie odpowiedzialności
Informacje i publikacje przygotowane przez TradingView lub jego użytkowników, prezentowane na tej stronie, nie stanowią rekomendacji ani porad handlowych, inwestycyjnych i finansowych i nie powinny być w ten sposób traktowane ani wykorzystywane. Więcej informacji na ten temat znajdziesz w naszym Regulaminie.