Every trader knows: entering the market is one thing, but understanding where to take profit is another. Without a system, the chart turns into chaotic candles, and decisions are driven by emotions.
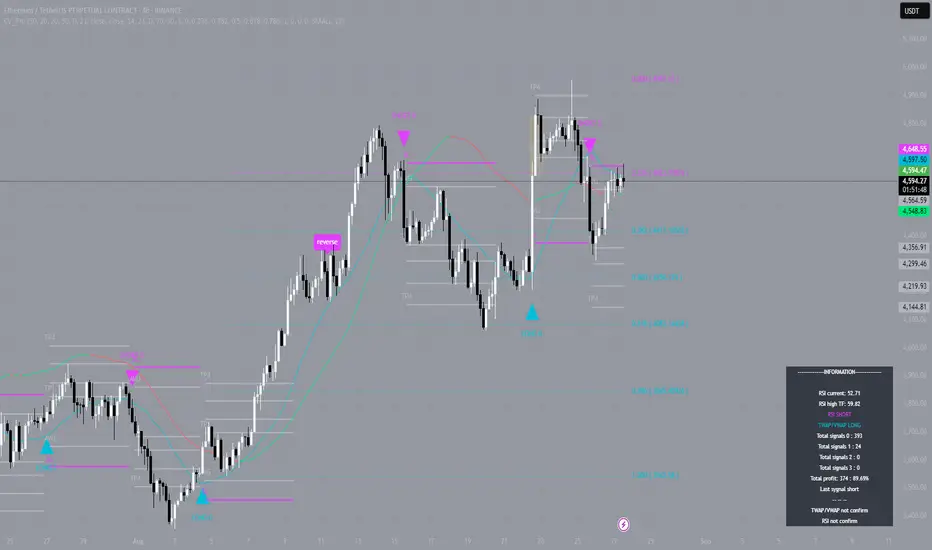
A recent move on Ethereum’s 4-hour timeframe clearly showed the value of structured visualization. The entry was around $4274, with price developing up to $4650, where many participants could have locked in profit before the trend shifted.
This isn’t randomness. It’s the power of levels that outline the market’s roadmap in advance: where strength is concentrated, where reversals may happen, and where profit-taking makes sense.
For beginners, such levels serve as a navigator: they reveal patterns that would otherwise take years to master.
For intermediate traders, it’s an accelerator: a tool that eliminates chaos, enforces discipline, and reduces mistakes caused by emotions.
For advanced traders, it’s about saving time and keeping strategy under control without redrawing charts manually.
For investors, it provides a visual layer of clarity: entry and exit points become easier to track, and long-term strategies gain transparency.
The market will always move on its own terms. But traders have a choice — react to chaos or build structure. Visualization of levels provides the system: it shows the market map and helps maintain discipline regardless of volatility.
🟣indicator: t.me/CryptoVisionPro_news
🟣Forum: t.me/CryptoVision_Forum
🟣Forum: t.me/CryptoVision_Forum
Wyłączenie odpowiedzialności
Informacje i publikacje przygotowane przez TradingView lub jego użytkowników, prezentowane na tej stronie, nie stanowią rekomendacji ani porad handlowych, inwestycyjnych i finansowych i nie powinny być w ten sposób traktowane ani wykorzystywane. Więcej informacji na ten temat znajdziesz w naszym Regulaminie.