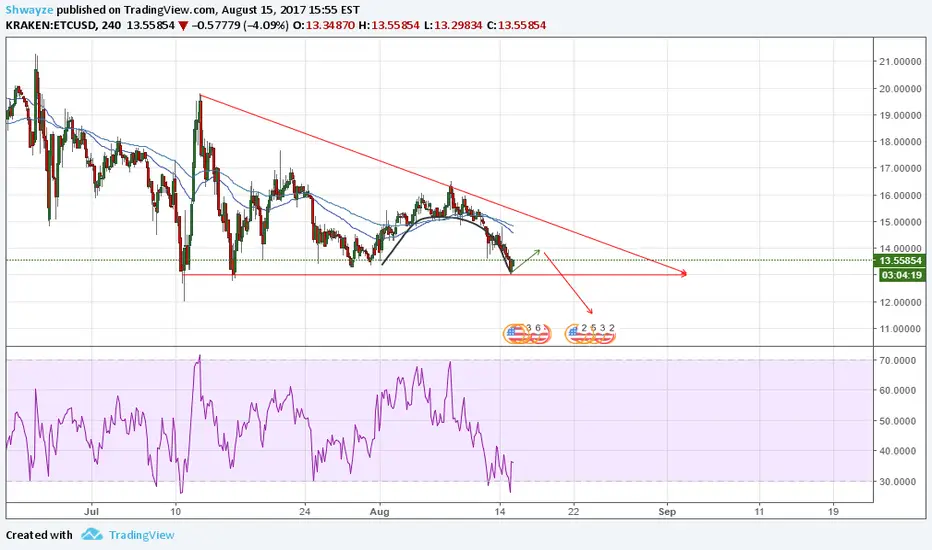
There are two ways to look at this chart from what I see. One, there is a double bottom, which also happens to form the bearish triangle. If there was massive volume displayed by the RSI, I would think this could be a reversal signal. But there isn't. Price didn't bounce with much bullish invigoration.
The second pattern I see, is an inverse cup and handle forming at the end of a long bearish triangle. The market has been going steadily down for some time now, maintaining the resistance level at $13.00. However, the market will test this level. We should see a slight up, which will form our handle.
If this pattern plays out, two things will happen. The bearish triangle will breakout at a downward trend, and the volume behind it will be considerable. The price should move down to $11.00, as the depth of the cup will be the blueprint we can use to find our next level down.
If we draw a fibonacci retracement for the entire upward movement on the daily charts, we will see that 11.8 is an important fibonacci resistance level, which is the 50%. But if this breaks, it will continue to 61.8% (longer term, now that I'm on daily charts) which roughly correlates to $9.50. Fibonacci resistance shown in chart below.

However, there is still a chance for a reversal pattern at bottom channel currently. Just keep an eye on volume and if the chart breaks downwards, we can start setting our targets.
The second pattern I see, is an inverse cup and handle forming at the end of a long bearish triangle. The market has been going steadily down for some time now, maintaining the resistance level at $13.00. However, the market will test this level. We should see a slight up, which will form our handle.
If this pattern plays out, two things will happen. The bearish triangle will breakout at a downward trend, and the volume behind it will be considerable. The price should move down to $11.00, as the depth of the cup will be the blueprint we can use to find our next level down.
If we draw a fibonacci retracement for the entire upward movement on the daily charts, we will see that 11.8 is an important fibonacci resistance level, which is the 50%. But if this breaks, it will continue to 61.8% (longer term, now that I'm on daily charts) which roughly correlates to $9.50. Fibonacci resistance shown in chart below.
However, there is still a chance for a reversal pattern at bottom channel currently. Just keep an eye on volume and if the chart breaks downwards, we can start setting our targets.
Wyłączenie odpowiedzialności
Informacje i publikacje przygotowane przez TradingView lub jego użytkowników, prezentowane na tej stronie, nie stanowią rekomendacji ani porad handlowych, inwestycyjnych i finansowych i nie powinny być w ten sposób traktowane ani wykorzystywane. Więcej informacji na ten temat znajdziesz w naszym Regulaminie.