Dell Technologies  DELL has fallen some 25% in just three weeks after hitting an 18-month high earlier this month, and the stock has trailed the S&P 500
  SPX in almost every timeframe from one month to five years. Let's check out the computer-hardware and enterprise-solutions firm's chart and fundamentals ahead of this week's Q3 earnings release.
Dell's Fundamental Analysis
DELL is set to report fiscal Q3 results after the bell on Tuesday, with the Street looking for $2.48 in adjusted earnings per share on $27.3 billion of revenue.
That would represent a 15.3% gain from the $2.15 in adjusted EPS that DELL recorded in the year-ago period, as well as about a 12% increase from the $24.4 billion in sales it saw in fiscal Q3 2025.
However, analysts are split on how DELL is doing. Seven of the 22 sell-side analysts that I can find that cover the stock have revised their earnings estimates higher since the quarter began, while 10 have cut their estimates and five have made no changes.
But perhaps most significantly, Morgan Stanley analyst Erik Woodring -- who last week downgraded Dell and a plethora of other tech stocks in a single day -- gave DELL a double downgrade.
Woodring, who's rated at five stars out of a possible five by TipRanks, cut the stock from "Overweight" (a buy-equivalent rating) all the way down to "Underweight" (a sell-equivalent).
Making matters worse, the analyst reduced his DELL target price to $110 from a previous $144 at a time when the stock had closed the session before at $133.76. (TipRanks listed analysts' consensus 12-month Dell price target at $167.14 at last check vs. the $127.36 the stock was trading at Monday afternoon.)
DELL fell 8.4% on Woodring's double downgrade, but soon made contact with its 200-day Simple Moving Average (or "SMA") and showed signs of bottoming out. Still, that's certainty not what the stock needed going into earnings.
Dell's Technical Analysis
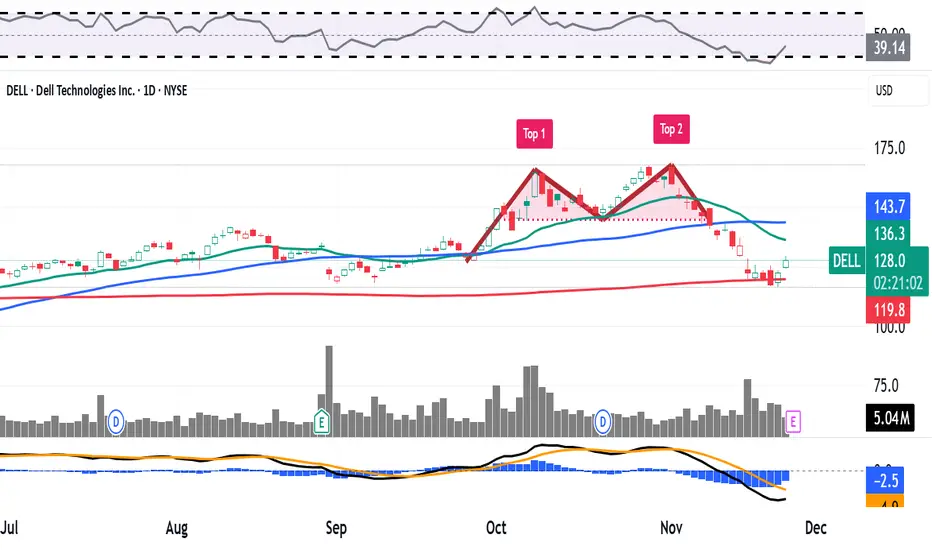
Now let's look at DELL's chart going back some five months and running through Wednesday afternoon:

Readers will see that DELL rallied in mid- to late September, then sold off, then rallied again and then sold off again.
By November, the stock had developed a double-top pattern of bearish reversal, as denoted by the two red boxes and pink-shaded triangles at the chart's right.
This pattern had a $145 downside pivot that was triggered recently, then DELL gave up its 50-day SMA (marked with a blue line) shortly thereafter.
Next, the stock suffered what some call a "mini death cross or "swing trader's death cross."
That's when a stock's 21-day Exponential Moving Average (or "EMA," marked with a green line above) crosses below the 50-day SMA. Technicians generally see this as a negative for a stock's price.
But DELL finally appeared to find support at its 200-day SMA (the red line above) after some air had been let out of the balloon.
Is there any more help to be found here for the stock? Let's look at DELL's secondary technical indicators for some signs.
On one hand, the stock's Relative Strength Index (marked with a gray line at the chart's top) has sunk into technically oversold territory.
However, DELL's daily Moving Average Convergence Divergence indicator (or "MACD," marked with black and gold lines and blue bars at the chart's bottom) is about as bearish looking as daily MACDs can get.
For instance, the histogram of the stock's 9-day EMA (marked with blue bars) is deep into negative territory. Meanwhile, the 12-day EMA (the black line) is running below the 26-day EMA (the gold line), and both of those lines are below zero. These are all bearish technical signals.
An Options Option
Options traders who are somewhat bullish on DELL but not confident enough to lay out a ton of money for an equity stake might choose to employ a so-called "ratio-call spread" based on the stock's technical support indicators.
This involves buying a call at the same time as selling multiple higher calls with the same expiration date.
Here's an example:
-- Long one DELL $120 call with a Nov. 28 expiration (i.e., after this week's earnings come out). This cost about $6.40 at recent prices.
-- Short two Nov. 28 DELL $144 calls for roughly $0.80 apiece.
Net Debit: $4.80.
This trader would break even if DELL rises to $124.80 at expiration vs. Thursday's close at $119.38.
If the stock rises above $120, then the person would wind up long 100 DELL shares at a $124.80 net cost basis.
Conversely, should the shares be at or below $120 at expiration, the trader would be out the $4.80 net debit.
The options trader's theoretical maximum gain would be $19.20 and would occur at $144, the strike price of the two short calls.
If the stock is above $144 at expiration, the trader would end up short 100 shares of DELL with the potential for unlimited loss.
Meanwhile, any increase in the stock price beyond $144 would start to eat into the gain made on the long call until this trade reaches its upper breakeven level at $163.20.
(Moomoo Technologies Inc. Markets Commentator Stephen "Sarge" Guilfoyle had no position in DELL at the time of writing this column.)
This article discusses technical analysis, other approaches, including fundamental analysis, may offer very different views. The examples provided are for illustrative purposes only and are not intended to be reflective of the results you can expect to achieve. Specific security charts used are for illustrative purposes only and are not a recommendation, offer to sell, or a solicitation of an offer to buy any security. Past investment performance does not indicate or guarantee future success. Returns will vary, and all investments carry risks, including loss of principal. This content is also not a research report and is not intended to serve as the basis for any investment decision. The information contained in this article does not purport to be a complete description of the securities, markets, or developments referred to in this material. Moomoo and its affiliates make no representation or warranty as to the article's adequacy, completeness, accuracy or timeliness for any particular purpose of the above content. Furthermore, there is no guarantee that any statements, estimates, price targets, opinions or forecasts provided herein will prove to be correct.
Options trading is risky and not appropriate for everyone. Read the Options Disclosure Document (https://j.moomoo.com/017y9J) before trading. Options are complex and you may quickly lose the entire investment. Supporting docs for any claims will be furnished upon request.
Options trading subject to eligibility requirements. Strategies available will depend on options level approved.
Maximum potential loss and profit for options are calculated based on the single leg or an entire multi-leg trade remaining intact until expiration with no option contracts being exercised or assigned. These figures do not account for a portion of a multi-leg strategy being changed or removed or the trader assuming a short or long position in the underlying stock at or before expiration. Therefore, it is possible to lose more than the theoretical max loss of a strategy.
The Analyst Ratings feature comes from TipRanks, an independent third party. The accuracy, completeness, or reliability cannot be guaranteed and should not be relied upon as a primary basis for any investment decision. The target prices are intended for informational purposes only, not recommendations, and are also not guarantees of future results.
Moomoo is a financial information and trading app offered by Moomoo Technologies Inc. In the U.S., investment products and services on Moomoo are offered by Moomoo Financial Inc., Member FINRA/SIPC.
TradingView is an independent third party not affiliated with Moomoo Financial Inc., Moomoo Technologies Inc., or its affiliates. Moomoo Financial Inc. and its affiliates do not endorse, represent or warrant the completeness and accuracy of the data and information available on the TradingView platform and are not responsible for any services provided by the third-party platform.
Dell's Fundamental Analysis
DELL is set to report fiscal Q3 results after the bell on Tuesday, with the Street looking for $2.48 in adjusted earnings per share on $27.3 billion of revenue.
That would represent a 15.3% gain from the $2.15 in adjusted EPS that DELL recorded in the year-ago period, as well as about a 12% increase from the $24.4 billion in sales it saw in fiscal Q3 2025.
However, analysts are split on how DELL is doing. Seven of the 22 sell-side analysts that I can find that cover the stock have revised their earnings estimates higher since the quarter began, while 10 have cut their estimates and five have made no changes.
But perhaps most significantly, Morgan Stanley analyst Erik Woodring -- who last week downgraded Dell and a plethora of other tech stocks in a single day -- gave DELL a double downgrade.
Woodring, who's rated at five stars out of a possible five by TipRanks, cut the stock from "Overweight" (a buy-equivalent rating) all the way down to "Underweight" (a sell-equivalent).
Making matters worse, the analyst reduced his DELL target price to $110 from a previous $144 at a time when the stock had closed the session before at $133.76. (TipRanks listed analysts' consensus 12-month Dell price target at $167.14 at last check vs. the $127.36 the stock was trading at Monday afternoon.)
DELL fell 8.4% on Woodring's double downgrade, but soon made contact with its 200-day Simple Moving Average (or "SMA") and showed signs of bottoming out. Still, that's certainty not what the stock needed going into earnings.
Dell's Technical Analysis
Now let's look at DELL's chart going back some five months and running through Wednesday afternoon:
Readers will see that DELL rallied in mid- to late September, then sold off, then rallied again and then sold off again.
By November, the stock had developed a double-top pattern of bearish reversal, as denoted by the two red boxes and pink-shaded triangles at the chart's right.
This pattern had a $145 downside pivot that was triggered recently, then DELL gave up its 50-day SMA (marked with a blue line) shortly thereafter.
Next, the stock suffered what some call a "mini death cross or "swing trader's death cross."
That's when a stock's 21-day Exponential Moving Average (or "EMA," marked with a green line above) crosses below the 50-day SMA. Technicians generally see this as a negative for a stock's price.
But DELL finally appeared to find support at its 200-day SMA (the red line above) after some air had been let out of the balloon.
Is there any more help to be found here for the stock? Let's look at DELL's secondary technical indicators for some signs.
On one hand, the stock's Relative Strength Index (marked with a gray line at the chart's top) has sunk into technically oversold territory.
However, DELL's daily Moving Average Convergence Divergence indicator (or "MACD," marked with black and gold lines and blue bars at the chart's bottom) is about as bearish looking as daily MACDs can get.
For instance, the histogram of the stock's 9-day EMA (marked with blue bars) is deep into negative territory. Meanwhile, the 12-day EMA (the black line) is running below the 26-day EMA (the gold line), and both of those lines are below zero. These are all bearish technical signals.
An Options Option
Options traders who are somewhat bullish on DELL but not confident enough to lay out a ton of money for an equity stake might choose to employ a so-called "ratio-call spread" based on the stock's technical support indicators.
This involves buying a call at the same time as selling multiple higher calls with the same expiration date.
Here's an example:
-- Long one DELL $120 call with a Nov. 28 expiration (i.e., after this week's earnings come out). This cost about $6.40 at recent prices.
-- Short two Nov. 28 DELL $144 calls for roughly $0.80 apiece.
Net Debit: $4.80.
This trader would break even if DELL rises to $124.80 at expiration vs. Thursday's close at $119.38.
If the stock rises above $120, then the person would wind up long 100 DELL shares at a $124.80 net cost basis.
Conversely, should the shares be at or below $120 at expiration, the trader would be out the $4.80 net debit.
The options trader's theoretical maximum gain would be $19.20 and would occur at $144, the strike price of the two short calls.
If the stock is above $144 at expiration, the trader would end up short 100 shares of DELL with the potential for unlimited loss.
Meanwhile, any increase in the stock price beyond $144 would start to eat into the gain made on the long call until this trade reaches its upper breakeven level at $163.20.
(Moomoo Technologies Inc. Markets Commentator Stephen "Sarge" Guilfoyle had no position in DELL at the time of writing this column.)
This article discusses technical analysis, other approaches, including fundamental analysis, may offer very different views. The examples provided are for illustrative purposes only and are not intended to be reflective of the results you can expect to achieve. Specific security charts used are for illustrative purposes only and are not a recommendation, offer to sell, or a solicitation of an offer to buy any security. Past investment performance does not indicate or guarantee future success. Returns will vary, and all investments carry risks, including loss of principal. This content is also not a research report and is not intended to serve as the basis for any investment decision. The information contained in this article does not purport to be a complete description of the securities, markets, or developments referred to in this material. Moomoo and its affiliates make no representation or warranty as to the article's adequacy, completeness, accuracy or timeliness for any particular purpose of the above content. Furthermore, there is no guarantee that any statements, estimates, price targets, opinions or forecasts provided herein will prove to be correct.
Options trading is risky and not appropriate for everyone. Read the Options Disclosure Document (https://j.moomoo.com/017y9J) before trading. Options are complex and you may quickly lose the entire investment. Supporting docs for any claims will be furnished upon request.
Options trading subject to eligibility requirements. Strategies available will depend on options level approved.
Maximum potential loss and profit for options are calculated based on the single leg or an entire multi-leg trade remaining intact until expiration with no option contracts being exercised or assigned. These figures do not account for a portion of a multi-leg strategy being changed or removed or the trader assuming a short or long position in the underlying stock at or before expiration. Therefore, it is possible to lose more than the theoretical max loss of a strategy.
The Analyst Ratings feature comes from TipRanks, an independent third party. The accuracy, completeness, or reliability cannot be guaranteed and should not be relied upon as a primary basis for any investment decision. The target prices are intended for informational purposes only, not recommendations, and are also not guarantees of future results.
Moomoo is a financial information and trading app offered by Moomoo Technologies Inc. In the U.S., investment products and services on Moomoo are offered by Moomoo Financial Inc., Member FINRA/SIPC.
TradingView is an independent third party not affiliated with Moomoo Financial Inc., Moomoo Technologies Inc., or its affiliates. Moomoo Financial Inc. and its affiliates do not endorse, represent or warrant the completeness and accuracy of the data and information available on the TradingView platform and are not responsible for any services provided by the third-party platform.
Wyłączenie odpowiedzialności
Informacje i publikacje nie stanowią i nie powinny być traktowane jako porady finansowe, inwestycyjne, tradingowe ani jakiekolwiek inne rekomendacje dostarczane lub zatwierdzone przez TradingView. Więcej informacji znajduje się w Warunkach użytkowania.
Wyłączenie odpowiedzialności
Informacje i publikacje nie stanowią i nie powinny być traktowane jako porady finansowe, inwestycyjne, tradingowe ani jakiekolwiek inne rekomendacje dostarczane lub zatwierdzone przez TradingView. Więcej informacji znajduje się w Warunkach użytkowania.