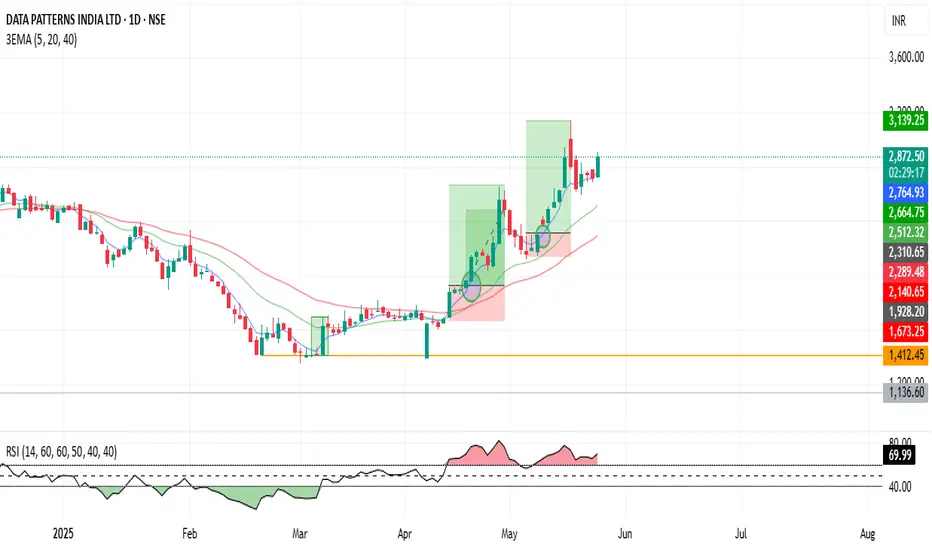
When a 20-day Exponential Moving Average (EMA) crosses above a 40-day EMA, it is generally considered a bullish signal, suggesting a potential uptrend in the asset's price. This "Golden Cross" can indicate that short-term momentum is outperforming long-term trends, potentially leading to further price increases.
But after that when candle cross above 5 EMA just take your buy position. Hold for next 5 days or wait for next one big candle with in 5-6 days & then after one red candle which completely without touch 5EMA. that day exit our swing position.
(The 5 EMA trading strategy involves using the 5-day Exponential Moving Average (EMA) to identify potential entry and exit points for trades. It's a popular strategy)
Wyłączenie odpowiedzialności
Informacje i publikacje przygotowane przez TradingView lub jego użytkowników, prezentowane na tej stronie, nie stanowią rekomendacji ani porad handlowych, inwestycyjnych i finansowych i nie powinny być w ten sposób traktowane ani wykorzystywane. Więcej informacji na ten temat znajdziesz w naszym Regulaminie.