Bitcoin Wave Analysis
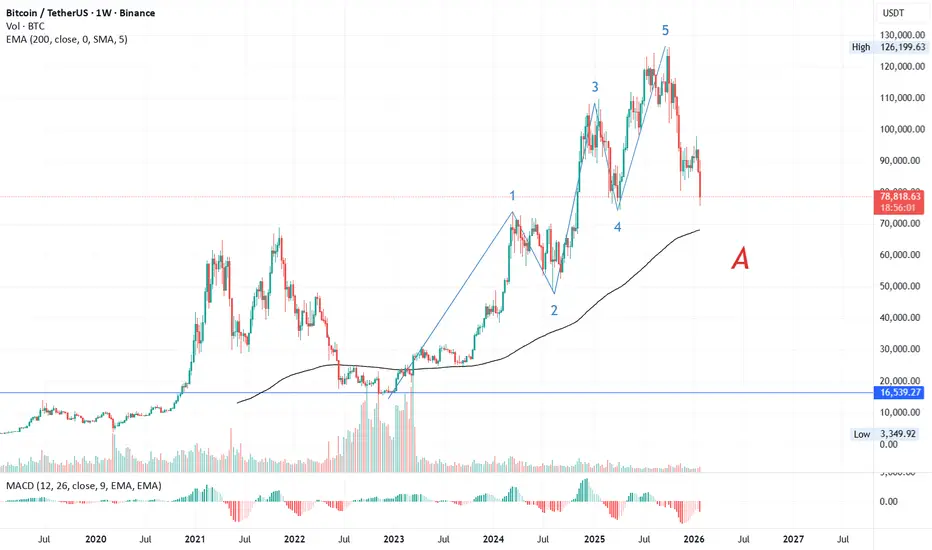
Bitcoin’s bull run began in December 2022 around $14,500, forming a clear impulsive structure:
- Wave 1: $73,700 (March 2024)
- Wave 2: $50,500 (August 2024)
- Wave 3: $108,000 (January 2025)
- Wave 4: $79,000 (March 2025)
- Wave 5: $126,199 before correction
After this five-wave move, Bitcoin entered a corrective phase. The A wave shows a five-wave subdivision, with Wave 1 extended. Elliott Wave theory suggests retracement often revisits Wave 2 territory, pointing to $65,000–$67,000, in line with the 200 EMA weekly (~$67,000). This implies a potential 15% drawdown from current levels.
Wyłączenie odpowiedzialności
Informacje i publikacje nie stanowią i nie powinny być traktowane jako porady finansowe, inwestycyjne, tradingowe ani jakiekolwiek inne rekomendacje dostarczane lub zatwierdzone przez TradingView. Więcej informacji znajduje się w Warunkach użytkowania.
Wyłączenie odpowiedzialności
Informacje i publikacje nie stanowią i nie powinny być traktowane jako porady finansowe, inwestycyjne, tradingowe ani jakiekolwiek inne rekomendacje dostarczane lub zatwierdzone przez TradingView. Więcej informacji znajduje się w Warunkach użytkowania.