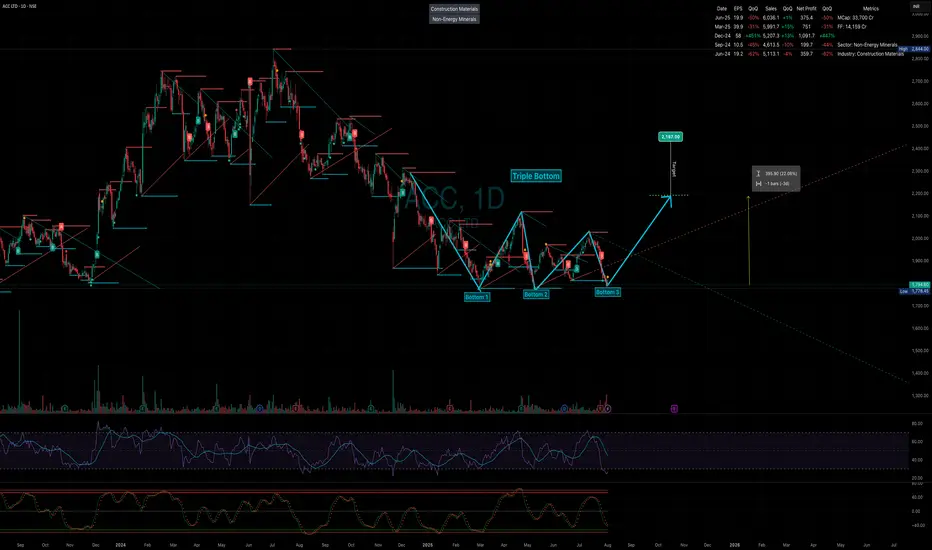
ACC Ltd. is currently showing a Triple Bottom formation on the weekly chart, indicating strong support around the ₹1810 - ₹1793 level . This pattern suggests that bearish pressure is weakening and a potential reversal is on the cards.
🔍 Key Technical Highlights:
Triple Bottom: The stock has tested the same support zone three times without breaking down, which is a classic bullish reversal signal.
Price Action: Current price is near the support base, offering a favorable risk-reward entry zone.
RSI: Weekly RSI shows signs of reverse sell divergence, hinting at a potential shift in momentum.
📈 Strategy:
This is a swing trading idea based on weekly chart structure. Entry is planned near the current level with a stop-loss slightly below the support zone. I plan to use pyramiding to add positions if momentum continues after breakout above neckline resistance.
⚠️ Disclaimer:
This analysis is for educational and informational purposes only. It is not intended as investment advice or a recommendation to buy or sell any securities. I am not a SEBI-registered advisor. Please do your own research and consult with a registered financial advisor before making any investment decisions. Trading and investing involve significant risk.
Uwaga
Correction: This is a swing trading idea based on 1 day chart structure.
Sameer Thorappa
Network Engineer transitioning into the world of investing. Passionate about swing trading, price action, and technical & fundamental analysis.
Network Engineer transitioning into the world of investing. Passionate about swing trading, price action, and technical & fundamental analysis.
Wyłączenie odpowiedzialności
Informacje i publikacje nie stanowią i nie powinny być traktowane jako porady finansowe, inwestycyjne, tradingowe ani jakiekolwiek inne rekomendacje dostarczane lub zatwierdzone przez TradingView. Więcej informacji znajduje się w Warunkach użytkowania.