Wskaźniki, strategie i biblioteki
This is a trending strategy designed for stock market, especially long trending assets such as TSLA, NIO, AMAZON and so on. Its made of volatility bands and weekly VWAP, in this case daily and weekly. This strategy has been adapted to go long only. Rules for entry For long , we want to enter close of a candle is above vwap weekly, and at the same time the...
Stock screener for Boom Hunter and Boom Hunter Pro entry zones. This script will screen 18 different stocks for entry zones. 1. Enter in any ticker ID's from charts you wish to scan in the settings. 2. Go to desired timeframe. 3. Click add alert button at top toolbar. 4. Select Boom Screener indicator, input alert notification settings and/or change alert name and...
Limited quarter level script but more flexible in compared to my FX script, same logic behind
This script will screen 12 different stocks and current chart (13 in total) for entry points from my relative volume indicator. 1. Enter in any ticker ID's from charts you wish to scan in the settings. 2. Go to desired timeframe. 3. Click add alert button at top toolbar. 4. Select RVOL Screener Alerts indicator, input alert notification settings and/or change...
English: This indicator has been developed as an early warning tool to estimate the probability of correction in the US stock market. It works best in the daily chart. Function: 1.) "Index-line" The underlying stock index is converted to a scale between 0% and 100% based on its 52-week highs and lows. Where 100% is closing price at 52-week high and 0% is closing...
This is a strategy, designed for long trends for stock and crypto market. Its made of ATR for volatility, EOM for volume and VORTEX for the trend direction. In this case on the ATR, I applied an EMA to check if current position is above the EMA -> bull trend, below ema -> bear trend For EOM I am using the positive and negative value scale, if its positive we are...
This is the indicator version of a simple, yet very efficient crypto strategy, adapted to 4h time frame, on big coins like ETH and BTC . However it can be adapted to other markets, timeframes etc For this strategy I use a combination of a trend line , an oscillator, price action and volume . This study has alert for both long and short entries/exit. The rules...
This is a simple, yet very efficient crypto strategy, adapted to 4h time frame, on big coins like ETH and BTC. However it can be adapted to other markets, timeframes etc For this strategy I use a combination of a trend line, an oscillator, price action and volume. This strategy has both the opportunity to go long and short. As well, it has a leverage simulator...
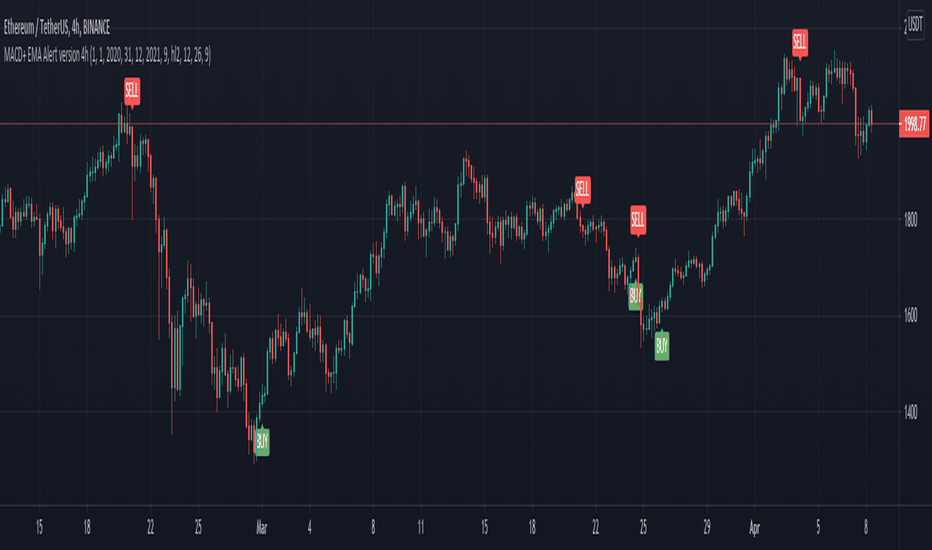
This is the study/indicator alert version of the macd + ema strategy. The strategy details are the following : Is a simple, yet efficient strategy, which is made from a combination of an oscillator and a moving average. Its setup for 4h candles with the current settings, however it can be adapted to other different timeframes. It works nicely ,beating the buy...
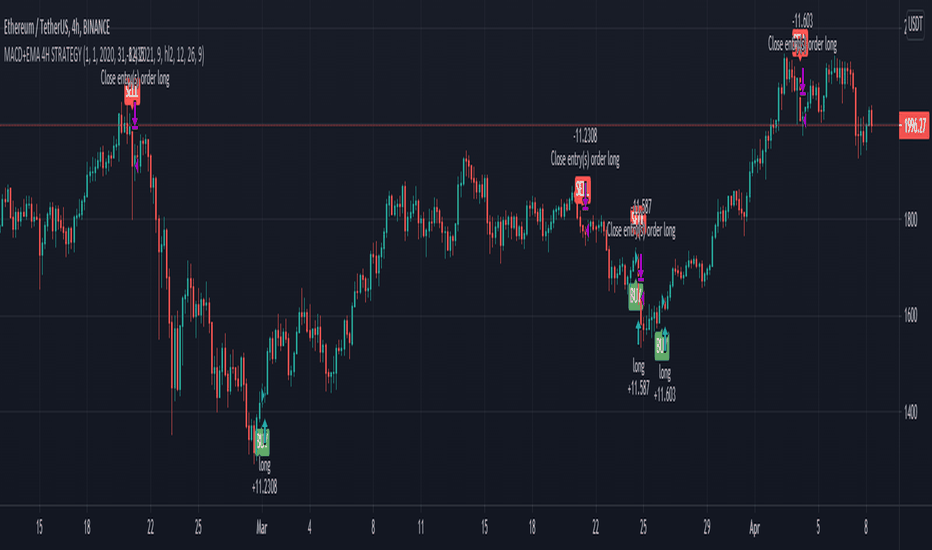
This is a simple, yet efficient strategy, which is made from a combination of an oscillator and a moving average. Its setup for 4h candles with the current settings, however it can be adapted to other different timeframes. It works nicely ,beating the buy and hold for both BTC and ETH over the last 3 years. As well with some optimizations and modifications it...
█ OVERVIEW This indicator plot basic key financial data to imitate the presentation format of several popular finance site, make it easier for a quick glance of overall company financial health without switching tabs for every single stocks. █ Financial Data Available: - Revenue & PAT (Profit after Tax) - Net Profit Margin (%) - Gross Profit Margin (%) ...
A simple way to identify potential breakouts at the New York market open. This indicator plots the high and low of the New York Pre-Market, providing a great visual of a potential breakout levels.
TradingView just recently announced the alert() function that allows you to create dynamic alerts from both strategies and studies. So I decided to update custom screener I published before. It was based on alerts from orders in strategies, that was the only way to create dynamic alerts in PineScript at that point. With the alert() function code become cleaner...
This is an improved version of Fisher, which use as a source the distance from EMA , compared to the initial source which was on the close of a candle. It can be used in any market, any time frame . For conditions we have multiple conditions for the logic, in this case initially if our fisher is above 0 is a long direction ,if its belowe 0 its a short...
3 Weeks Tight - Introduction 3 weeks tight is a bullish continuation pattern discovered by IBD's founder, William O'Neil. The pattern can used as an opportunity to add to an existing position as it often occurs after a breakout above a cup with handle or other technical pattern. The 3 weeks tight pattern forms when a stock closes within approximately 1% to 1.5%...
Today I bring you a simple and efficient indicator/strategy based only on HA. Can be used together with other TA tools or alone. The idea behind is simple : We have to forms to calculate the candle, using inner HA candles or normal candles. Once we have that we apply certain rules to get the max high, min low, open and close(ohlc) With that then we check for...
█ OVERVIEW Relative Strength Index is a momentum oscillator developed by J. Wilder. The original version of RSI rescaled the relative strength measurement to range. While the rescaling is useful for readability, This non-rescaled version tells the exact average relative strength of the movement for the past period, and give another way to put the relative...
█ OVERVIEW This is Screener script for Mean Reversion Channel Indicator █ Description & How To Use The screener works by scanning through up to 40 symbols and list down symbols that are currently within Overbought/Oversold Zone as defined by Mean Reversion Channel indicator. The Overbought/Oversold Zone are further categorized and sorted by: Strong :...


![Financial Highlights [Fundamentals] MSFT: Financial Highlights [Fundamentals]](https://s3.tradingview.com/k/kQfoloe5_mid.png)


![Custom Screener with Alerts V2 [QuantNomad] SPX: Custom Screener with Alerts V2 [QuantNomad]](https://s3.tradingview.com/y/YXL50xhh_mid.png)


