SMOOTHED RSI SWITCHThis more complex take on the traditional RSI provides clearer entry and exit points and looks beyond just overbought/oversold levels, altogether creating a more robust trading strategy.
The RSI is smoothed by the Hull MA with adjustable periods.
Although a variety of strategies can be developed using this indicator. I intended its most profitable use be as follows:
Entries are to be taken when the oscillator flips from red to clear and/or directly from red to green. Sell/short positions are to be take when the oscillator flips from green to clear and/or directly from green to red.
Wyszukaj w skryptach "hull+ma通达信源码"

MTF Bullish/Bearish IndicatorThe script plots a bullish/bearish indicator by evaluating a variety of moving averages for a security across multiple timeframes. It's derived from built in Technical Analysis indicator published by TradingView. The result of evaluation is plotted on the chart in green light/red light format in a configurable location.
evaluated moving averages include
- SMA 10, 20, 30, 50, 100, 200
- EMA 10, 20, 30, 50, 100, 200
- Hull MA 9
- VWMA 20
- Ichimoku Cloud
moving averages are evaluated at chart timeframes and 5 min, 15 min, 30 min, 120 min, 240 min, and daily by default but can be customized.

Zig Lines with Percent & ValueOverview, Features, and Usage:
The Zig Lines with Percent & Value is an indicator that highlights the highest and lowest points of the market from pivot points and zigzag lines based on the ZigZag Period setting. By a default value of 13 for the ZigZag Period this works well on Bitcoin or other alt coins on the 1 hour or higher timeframe charts.
What makes this indicator unique is that it draws a green line to signify an uptrend or a red line to signify a down trend. It will also show the percent difference between the previous point/line, for example: If you see a -negative percentage point with a red line drawn to it, then you are looking at a low pivot point and then as the green line is drawn to a +positive percentage value the percentage you see is the difference between the two points. This is great to see a trend reversal as you can look at previous pivot points and notice about how far the price moves before it changes direction (trend reversal).
There is an invisible EMA line that is used to assist with coloring the negative vs positive values. The value above or below the percentage is the lowest or highest price at that pivot point . The display of the price at the pivot point depends on your ZigZag Period setting and the timeframe of your chart.
Added Bollinger Bands as it fits perfectly with the visuals of the Zig Lines & Pivots.
Usage of Bollinger Bands:
~As the price or candle gets close to the top or bottom of the Bollinger band it can give you a better confirmation that the pivot location is at it's final place, and the trend is more likely to switch directions.
It’s important to know this indicator should not be used for alerts of any type it does repaint as the green or red line is drawing based on live chart data and it can change depending on the direction of the market. This is a great visual tool for trend analysis or to be used with other indicators as a confirmation for a possible good entry or exit position.
Credits ( and consent to use ):
Credits go to user LonesomeTheBlue for creation of this 'Double Zig Zag with HHLL' script.
The addition of the Value above/below the Percentages is from user Noldo and that script is found here:
The Bollinger Bands setup was suggested by user countseven12 and his script that uses the same BB setup is found here:
References:
1. Chen, James. (2021 March 15). Zig Zag Indicator . Received from http: www.investopedia.com
2. Mitchell, Cory. (2021 April 30). Pivot Points . Received from http: www.investopedia.com

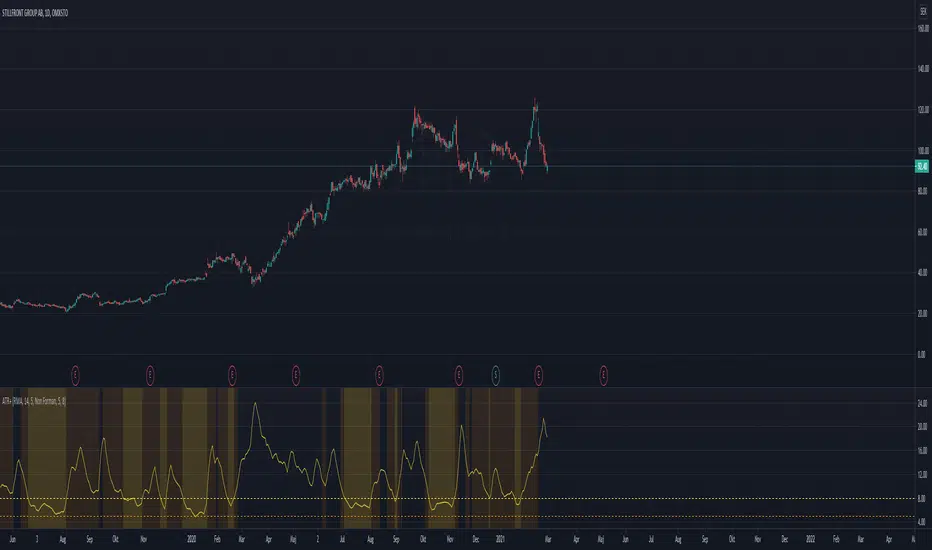
ATR+(Experimental)
I often use the ATR as a volatility filter, to get better entries or to just get a quick understand of the volatility when screening different stocks.
With this indicator you can use the ATR in a few different ways:
-- Dynamic ATR --
To get more comparability between stocks I use a dynamic/normalized ATR, so I've experimented with two different methods.
ATR% can be calculated using John Forman’s approach called Normalized ATR (ATR / Close * 100). Or it can be calculated using what I call "Non Forman",
where the normalization happens to the true range and not to the average true range (average of (TR / Close * 100)). I think this method is "cleaner",
though the difference between the two is minimal. For more on this see www.macroption.com
You can chose between normal ATR (not normalized), Forman's normazation method, and "Non-Forman" normalization.
-- Smoothed ATR --
I originally used an ATR on a higher timeframe to get an idea of the overall volatility. But with higher time frames you always end up lag (or repainting
issues when combining into an indicator). So I expertimented on smoothing the true range, by including several bars into the calculation. I most trade
on a daily time frame so to my default "smoothing" is calculating the true range based on the last 5 days. This pretty much equals how the weekly TR
would be calculated, but since it updates daily we get a different result.
You can chose between displaying the standard ATR, the smoothed ATR or both.
-- Thresholds --
To make it more clear and visually more appealing I added thresholds and I'm plotting warning zones for low volatily.
-- Moving Average Method --
I think the best results from ATR comes when using RMA. But since I wanted to experiment with different options, the moving averages can be done using
RMA, SMA, EMA, Hull MA, or WMA.
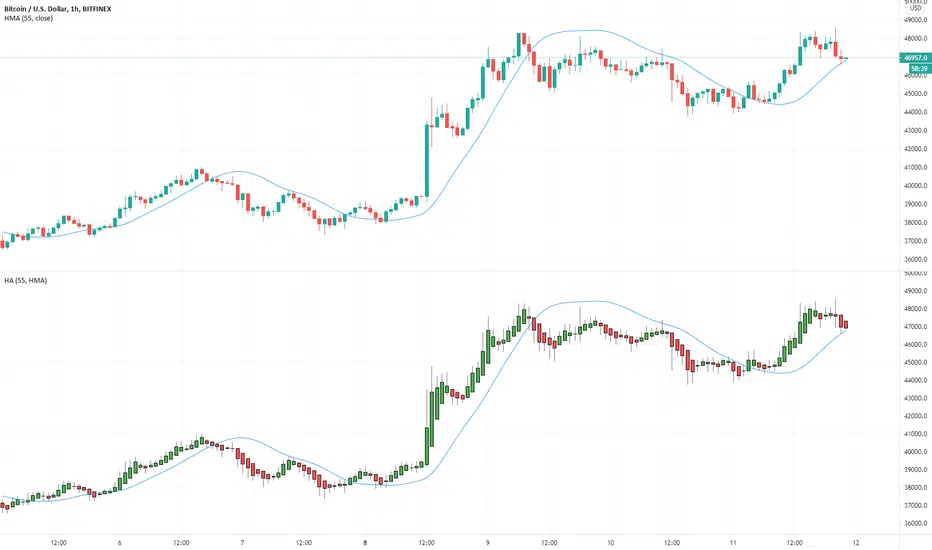
Multiple Moving Averages for Heikin Ashi I want to give credits to @QuantNomad, i got the heikin ashi part of the script from this open script /0iKy7lyG-QuantNomad-Heikin-Ashi-PSAR-Strategy/;
and to the other guy that provided a 17 type of moving average script open source but i forgot his name, if someone remember please tell me.
My idea was to see how the different types of moving averages behaves in a Heinkin Ashi chart, you can change to more than 15 types of Moving Average and use it the way you want it.
For the source of the moving averages i used a simple moving average of 1 period using the high of the heikin ashi candle, low of it and divided by 2 as the source of the different types of moving averages.
Different types of Moving Averages
Moving Average Types
SMA ---> Simple
WMA ---> Weighted
VWMA ---> Volume Weighted
EMA ---> Exponential
DEMA ---> Double EMA
ALMA ---> Arnaud Legoux
HMA ---> Hull MA
SMMA ---> Smoothed
LSMA ---> Least Squares
KAMA ---> Kaufman Adaptive
TEMA ---> Triple EMA
ZLEMA ---> Zero Lag
FRAMA ---> Fractal Adaptive
VIDYA ---> Variable Index Dynamic Average
JMA ---> Jurik Moving Average
T3 ---> Tillson
TRIMA ---> Triangular
The type of moving average you select will appear in a separated chart with Heikin Ashi candles, like in the image above.
Efficient Work [LucF]█ OVERVIEW
Efficient Work measures the ratio of price movement from close to close ( resulting work ) over the distance traveled to the high and low before settling down at the close ( total work ). The closer the two values are, the more Efficient Work approaches its maximum value of +1 for an up move or -1 for a down move. When price does not change, Efficient Work is zero.
Higher values of Efficient Work indicate more efficient price travel between the close of two successive bars, which I interpret to be more significant, regardless of the move's amplitude. Because it measures the direction and strength of price changes rather than their amplitude, Efficient Work may be thought of as a sentiment indicator.
█ CONCEPTS
This oscillator's design stems from a few key concepts.
Relative Levels
Other than the centerline, relative rather than absolute levels are used to identify levels of interest. Accordingly, no fixed levels correspond to overbought/oversold conditions. Relative levels of interest are identified using:
• A Donchian channel (historical highs/lows).
• The oscillator's position relative to higher timeframe values.
• Oscillator levels following points in time where a divergence is identified.
Higher timeframes
Two progressively higher timeframes are used to calculate larger-context values for the oscillator. The rationale underlying the use of timeframes higher than the chart's is that, while they change less frequently than the values calculated at the chart's resolution, they are more meaningful because more work (trader activity) is required to calculate them. Combining the immediacy of values calculated at the chart's resolution to higher timeframe values achieves a compromise between responsiveness and reliability.
Divergences as points of interest rather than directional clues
A very simple interpretation of what constitutes a divergence is used. A divergence is defined as a discrepancy between any bar's direction and the direction of the signal line on that same bar. No attempt is made to attribute a directional bias to divergences when they occur. Instead, the oscillator's level is saved and subsequent movement of the oscillator relative to the saved level is what determines the bullish/bearish state of the oscillator.
Conservative coloring scheme
Several additive coloring conditions allow the bull/bear coloring of the oscillator's main line to be restricted to specific areas meeting all the selected conditions. The concept is built on the premise that most of the time, an oscillator's value should be viewed as mere noise, and that somewhat like price, it only occasionally conveys actionable information.
█ FEATURES
Plots
• Three lines can be plotted. They are named Main line , Line 2 and Line 3 . You decide which calculation to use for each line:
• The oscillator's value at the chart's resolution.
• The oscillator's value at a medium timeframe higher than the chart's resolution.
• The oscillator's value at the highest timeframe.
• An aggregate line calculated using a weighed average of the three previous lines (see the Aggregate Weights section of Inputs to configure the weights).
• The coloring conditions, divergence levels and the Hi/Lo channel always apply to the Main line, whichever calculation you decide to use for it.
• The color of lines 2 and 3 are fixed but can be set in the "Colors" section of Inputs.
• You can change the thickness of each line.
• When the aggregate line is displayed, higher timeframe values are only used in its calculation when they become available in the chart's history,
otherwise the aggregate line would appear much later on the chart. To indicate when each higher timeframe value becomes available,
a small label appears near the centerline.
• Divergences can be shown as small dots on the centerline.
• Divergence levels can be shown. The level and fill are determined by the oscillator's position relative to the last saved divergence level.
• Bull/bear markers can be displayed. They occur whenever a new bull/bear state is determined by the "Main Line Coloring Conditions".
• The Hi/Lo (Donchian) channel can be displayed, and its period defined.
• The background can display the state of any one of 11 different conditions.
• The resolutions used for the higher timeframes can be displayed to the right of the last bar's value.
• Four key values are always displayed in the Data Window (fourth icon down to the right of your chart):
oscillator values for the chart, medium and highest timeframes, and the oscillator's instant value before it is averaged.
Main Line Coloring Conditions
• Nine different conditions can be selected to determine the bull/bear coloring of the main line. All conditions set to "ON" must be met to determine the bull/bear state.
• A volatility state can also be used to filter the conditions.
• When the coloring conditions and the filter do not allow for a bull/bear state to be determined, the neutral color is used.
Signal
• Seven different averages can be used to calculate the average of the oscillator's value.
• The average's period can be set. A period of one will show the instant value of the oscillator,
provided you don't use linear regression or the Hull MA as they do not work with a period of one.
• An external signal can be used as the oscillator's instant value. If an already averaged external value is used, set the period to one in this indicator.
• For the cases where an external signal is used, a centerline value can be set.
Higher Timeframes
• The two higher timeframes are named Medium timeframe and Highest timeframe . They can be determined using one of three methods:
• Auto-steps: the higher timeframes are determined using the chart's resolution. If the chart uses a seconds resolution, for example,
the medium and highest resolutions will be 15 and 60 minutes.
• Multiples: the timeframes are calculated using a multiple of the chart's resolution, which you can set.
• Fixed: the set timeframes do not change with the chart's resolution.
Repainting
• Repainting can be controlled separately for the chart's value and the higher timeframe values.
• The default is a repainting chart value and non-repainting higher timeframe values. The Aggregate line will thus repaint by default,
as it uses the chart's value along with the higher timeframes values.
Aggregate Weights
• The weight of each component of the Aggregate line can be set.
• The default is equal weights for the three components, meaning that the chart's value accounts for one third of the weight in the Aggregate.
High Volatility
• This provides control over the volatility filter used in the Main line's coloring conditions and the background display.
• Volatility is determined to be high when the short-term ATR is greater than the long-term ATR.
Colors
• You can define your own colors for all of the oscillator's plots.
• The default colors will perform well on both white and black chart backgrounds.
Alerts
• An alert can be defined for the script. The alert will trigger whenever a bull/bear marker appears in the indicator's display.
The particular combination of coloring conditions and the display of bull/bear markers when you create the alert will thus determine when the alert triggers.
Once the alerts are created, subsequent changes to the conditions controlling the display of markers will not affect the existing alert(s).
• You can create multiple alerts from this script, each triggering on different conditions.
Backtesting & Trading Engine Signal Line
• An invisible plot named "BTE Signal" is provided. It can be used as an entry signal when connected to the PineCoders Backtesting & Trading Engine as an external input.
It will generate an entry whenever a marker is displayed.
█ NOTES
• I do not know for sure if the calculations in Efficient Work are original. I apologize if they are not.
• Because this version of Efficient Work only has access to OHLC information, it cannot measure the total distance traveled through all of a bar's ticks, but the indicator nonetheless behaves in a manner consistent with the intentions underlying its design.
For Pine coders
This code was written using the following standards:
• The PineCoders Coding Conventions for Pine .
• A modified version of the PineCoders MTF Oscillator Framework and MTF Selection Framework .

MTF Oscillator Framework [PineCoders]This framework allows Pine coders to quickly build a complete multi-timeframe oscillator from any calculation producing values around a centerline, whether the values are bounded or not. Insert your calculation in the script and you have a ready-to-publish MTF Oscillator offering a plethora of presentation options and features.
█ HOW TO USE THE FRAMEWORK
1 — Insert your calculation in the `f_signal()` function at the top of the "Helper Functions" section of the script.
2 — Change the script's name in the `study()` declaration statement and the `alertcondition()` text in the last part of the "Plots" section.
3 — Adapt the default value used to initialize the CENTERLINE constant in the script's "Constants" section.
4 — If you want to publish the script, copy/paste the following description in your new publication's description and replace the "OVERVIEW" section with a description of your calculations.
5 — Voilà!
═════════════════════════════════════════════════════════════════════════
█ OVERVIEW
This oscillator calculates a directional value of True Range. When a bar is up, the positive value of True Range is used. A negative value is used when the bar is down. When there is no movement during the bar, a zero value is generated, even if True Range is different than zero. Because the unit of measure of True Range is price, the oscillator is unbounded (it does not have fixed upper/lower bounds).
True Range can be used as a metric for volatility, but by using a signed value, this oscillator will show the directional bias of progressively increasing/decreasing volatility, which can make it more useful than an always positive value of True Range.
The True Range calculation appeared for the first time in J. Welles Wilder's New Concepts in Technical Trading Systems book published in 1978. Wilder's objective was to provide a reliable measure of the effective movement—or range—between two bars, to measure volatility. True Range is also the building block used to calculate ATR (Average True Range), which calculates the average of True Range values over a given period using the `rma` averaging method—the same used in the calculation of another of Wilder's remarkable creations: RSI.
█ CONCEPTS
This oscillator's design stems from a few key concepts.
Relative Levels
Other than the centerline, relative rather than absolute levels are used to identify levels of interest. Accordingly, no fixed levels correspond to overbought/oversold conditions. Relative levels of interest are identified using:
• A Donchian channel (historical highs/lows).
• The oscillator's position relative to higher timeframe values.
• Oscillator levels following points in time where a divergence is identified.
Higher timeframes
Two progressively higher timeframes are used to calculate larger-context values for the oscillator. The rationale underlying the use of timeframes higher than the chart's is that, while they change less frequently than the values calculated at the chart's resolution, they are more meaningful because more work (trader activity) is required to calculate them. Combining the immediacy of values calculated at the chart's resolution to higher timeframe values achieves a compromise between responsiveness and reliability.
Divergences as points of interest rather than directional clues
A very simple interpretation of what constitutes a divergence is used. A divergence is defined as a discrepancy between any bar's direction and the direction of the signal line on that same bar. No attempt is made to attribute a directional bias to divergences when they occur. Instead, the oscillator's level is saved and subsequent movement of the oscillator relative to the saved level is what determines the bullish/bearish state of the oscillator.
Conservative coloring scheme
Several additive coloring conditions allow the bull/bear coloring of the oscillator's main line to be restricted to specific areas meeting all the selected conditions. The concept is built on the premise that most of the time, an oscillator's value should be viewed as mere noise, and that somewhat like price, it only occasionally conveys actionable information.
█ FEATURES
Plots
• Three lines can be plotted. They are named Main line , Line 2 and Line 3 . You decide which calculation to use for each line:
• The oscillator's value at the chart's resolution.
• The oscillator's value at a medium timeframe higher than the chart's resolution.
• The oscillator's value at the highest timeframe.
• An aggregate line calculated using a weighed average of the three previous lines (see the Aggregate Weights section of Inputs to configure the weights).
• The coloring conditions, divergence levels and the Hi/Lo channel always apply to the Main line, whichever calculation you decide to use for it.
• The color of lines 2 and 3 are fixed but can be set in the "Colors" section of Inputs.
• You can change the thickness of each line.
• When the aggregate line is displayed, higher timeframe values are only used in its calculation when they become available in the chart's history,
otherwise the aggregate line would appear much later on the chart. To indicate when each higher timeframe value becomes available,
a small label appears near the centerline.
• Divergences can be shown as small dots on the centerline.
• Divergence levels can be shown. The level and fill are determined by the oscillator's position relative to the last saved divergence level.
• Bull/bear markers can be displayed. They occur whenever a new bull/bear state is determined by the "Main Line Coloring Conditions".
• The Hi/Lo (Donchian) channel can be displayed, and its period defined.
• The background can display the state of any one of 11 different conditions.
• The resolutions used for the higher timeframes can be displayed to the right of the last bar's value.
• Four key values are always displayed in the Data Window (fourth icon down to the right of your chart):
oscillator values for the chart, medium and highest timeframes, and the oscillator's instant value before it is averaged.
Main Line Coloring Conditions
• Nine different conditions can be selected to determine the bull/bear coloring of the main line. All conditions set to "ON" must be met to determine the bull/bear state.
• A volatility state can also be used to filter the conditions.
• When the coloring conditions and the filter do not allow for a bull/bear state to be determined, the neutral color is used.
Signal
• Seven different averages can be used to calculate the average of the oscillator's value.
• The average's period can be set. A period of one will show the instant value of the oscillator,
provided you don't use linear regression or the Hull MA as they do not work with a period of one.
• An external signal can be used as the oscillator's instant value. If an already averaged external value is used, set the period to one in this indicator.
• For the cases where an external signal is used, a centerline value can be set.
Higher Timeframes
• The two higher timeframes are named Medium timeframe and Highest timeframe . They can be determined using one of three methods:
• Auto-steps: the higher timeframes are determined using the chart's resolution. If the chart uses a seconds resolution, for example,
the medium and highest resolutions will be 15 and 60 minutes.
• Multiples: the timeframes are calculated using a multiple of the chart's resolution, which you can set.
• Fixed: the set timeframes do not change with the chart's resolution.
Repainting
• Repainting can be controlled separately for the chart's value and the higher timeframe values.
• The default is a repainting chart value and non-repainting higher timeframe values. The Aggregate line will thus repaint by default,
as it uses the chart's value along with the higher timeframes values.
Aggregate Weights
• The weight of each component of the Aggregate line can be set.
• The default is equal weights for the three components, meaning that the chart's value accounts for one third of the weight in the Aggregate.
High Volatility
• This provides control over the volatility filter used in the Main line's coloring conditions and the background display.
• Volatility is determined to be high when the short-term ATR is greater than the long-term ATR.
Colors
• You can define your own colors for all of the oscillator's plots.
• The default colors will perform well on both white and black chart backgrounds.
Alerts
• An alert can be defined for the script. The alert will trigger whenever a bull/bear marker appears in the indicator's display.
The particular combination of coloring conditions and the display of bull/bear markers when you create the alert will thus determine when the alert triggers.
Once the alerts are created, subsequent changes to the conditions controlling the display of markers will not affect the existing alert(s).
• You can create multiple alerts from this script, each triggering on different conditions.
Backtesting & Trading Engine Signal Line
• An invisible plot named "BTE Signal" is provided. It can be used as an entry signal when connected to the PineCoders Backtesting & Trading Engine as an external input.
It will generate an entry whenever a marker is displayed.
Look first. Then leap.

RSI Plus v1.0 by WilsonThis is a modified version of my RSI Cloud indicator. I have included the option to plot 2 moving averages. Type of moving averages included in the script are SMA, EMA, WMA, VWMA, Hull MA and ALMA. Option to fill colors and to add alerts are included. I shall be including more options in a future update.
Anyone is free to copy and modify the script. Wishing everyone happy and profitable trading.

Better Bollinger BandsIt is a highly configurable Bollinger Bands implementation.
You can choose different moving averages: EMA, SMA, WMA, VWMA, RMA (Wilder's EMA), ZLEMA, HMA (Hull MA), ALMA
Select between standard or mean deviation
You can use "High" or "Low" for upper and lower bands, which makes them much better for dynamic support-resistance
You can shift (offset) right the bands to use it as support and resistance in the future

Filter Amplitude Response Estimator - A Simple CalculationIn digital signal processing knowing how a system interact with the frequency content of an input signal is extremely important, the mathematical tool that give you this information is called "frequency response". The frequency response regroup two elements, the amplitude response, and the phase response. The amplitude response tells you how the system modify the amplitude of the frequency components in the input signal, the phase response tells you how the system modify the phase of the frequency components in the signal, each being a function of the frequency.
The today proposed tool aim to give a low resolution representation of the amplitude response of any filter.
What Is The Amplitude Response Of A Filter ?
Remember that filters allow to interact with the frequency content of a signal by amplifying, attenuating and/or removing certain frequency components in the input signal, the amplitude (also called magnitude) response of a filter let you know exactly how your filter change the amplitude of the frequency components in the input signal, another way to see the amplitude response is as a tool that tell you what is the peak amplitude of a filter using a sinusoid of a certain frequency as input signal.
For example if the amplitude response of a filter give you a value of 0.9 at frequency 0.5, it means that the filter peak amplitude using a sinusoid of frequency 0.5 is equal to 0.9.
There are several ways to calculate the frequency response of a filter, when our filter is a FIR filter (the filter impulse response is finite), the frequency response of the filter is the absolute value of the discrete Fourier transform (DFT) of the filter impulse response.
If you are curious about this process, know that the DFT of a N samples signal return N values, so if our FIR filter coefficients are composed of only 5 values we would get a frequency response of 5 values...which would not be useful, this is why we "pad" our coefficients with zeros, that is we add zeros to the start and end of our series of coefficients, this process is called "zero-padding", so if our series of coefficients is: (1,2,3,4,5), applying zero padding would give (0,0...1,2,3,4,5,...0,0) while keeping a certain symmetry. This is related to the concept of resolution, a low resolution amplitude response would be composed of a low number of values and would not be useful, this is why we use zero-padding to add more values thus increasing the resolution.
Making a Fourier transform in Pinescript is not doable, as you need the complex number i for computing a DFT, but thats not even the only problem, a DFT would not be that useful anyway (as the processes to make it useful in a trading context would be way too complex) . So how can we calculate a filter amplitude response without using a DFT ? The simple answer is by taking the peak amplitude of a filter using a sinusoid of a certain frequency as input, this is what the proposed tool do.
Using The Tool
The proposed tool give you a 50 point amplitude response from frequency 0.005 to 0.25 by default. the setting "Range Divisor" allow you to see the amplitude response by using a different range of frequency, for example if the range divisor is equal to 2 the filter amplitude response will be evaluated from frequency 0.0025 to 0.125.
In the script, filt hold the filter you want to see the frequency response, by default a simple moving average.
The position of the frequency response is defined by the "Show Amplitude Response At Bar Number" setting, if you want the frequency response to start at bar number 5000 then enter 5000, by default 10000. If you are not a premium set the number at 4000 and it should work.
amplitude response of a simple moving average of period 14, res = 2.
By default the amplitude response use an amplitude scale, a value of 1 represent an unchanged amplitude. You can use Dbfs (decibel full scale) instead by checking the "To Decibels (Full Scale)" setting.
Dbfs amplitude response, a value of 0 represent an unchanged amplitude.
Some Amplitude Responses
In order to prove the accuracy of the proposed tool we can compare the amplitude response given by the proposed tool with the mathematical function of the amplitude response of a simple moving average, that is:
abs(sin(pi*f*length)/(length*sin(pi*f)))
In cyan the amplitude response given by the proposed tool and in blue the above function. Below are the amplitude responses of some moving averages with period 14.
Amplitude response of an EMA, the EMA is a IIR filter, therefore the amplitude response can't be made by taking the DFT of the impulse response (as this ones has infinite length), however our tool can give its frequency response.
Amplitude response of the Hull MA, as you can see some frequencies are amplified, this is common with low-lag filters.
Gaussian moving average (ALMA), with offset = 0.5 and sigma = 6.
Simple moving average high-pass filter amplitude response
Center of gravity bandpass filter amplitude response
Center of gravity bandreject filter.
IMPORTANT!: The amplitude response of adaptive moving averages is not stationary and might change over time.
Conclusion
A tool giving the amplitude response of any filter has been presented, of course this method is not efficient at all and has a low resolution of 50 points (the common resolution is of 512 points) and is difficult to work with, but has the merit to work on Tradingview and can give the frequency response of IIR filters, if you really need to see the frequency response of a filter then i recommend you to use the function freqz from the scipy package.
I still hope you will enjoy using this tool to have a look at the amplitude responses of your favorite moving averages.
I'am aware of the current situation, however i'am somehow feeling left out from the pinescript community, let me know via PM if i have done something to you and i'll do my best to fix any problems i might have caused (or i might be being parano xD)

Envelop - Multi TypeEnvelop - Multi Type displays an upper envelope above a basis line and a lower envelope below the basis line. The basis line is a type of moving average, The envelopes are set a percentage away from the basis line.
A. Basis Line's Type
1. Gaussian Filter script by Alex Orekhov (everget)
2. SMA
3. EMA
4. TEMA
5. WMA
6. VWMA
7. DONCHIAN
8. Hull MA
9. ALMA
B. Default Percent of Envelop
1. Resolution (Time frame) <= 5: percent = 0.382
2. Resolution (Time frame) <= 15: percent = 0.5
3. Resolution (Time frame) <= 30: percent = 0.618
4. Resolution (Time frame) <= 60 (1H): percent = 0.786
5. Resolution (Time frame) <= 240 (4H): percent = 1.0
6. Resolution (Time frame) <= 1440 (1D): percent = 1.618
7. Resolution (Time frame) >1D: percent = 2.618
C. Custom Percent of Envelop
Default Percent of Envelop auto disable when Custom Percent of Envelop > 0 and the envelopes are set by user defined percentage.

Technical Analysis - Panel Info//A. Oscillators & B. Moving Averages base on TradingView's Technical Analysis by ThiagoSchmitz
//C.Pivot base on Ultimate Pivot Points Alerts by elbartt
//D. Summary & Panel info by anhnguyen14
Panel Info base on these indicators:
A. Oscillators
1. Rsi (14)
2. Stochastic (14,3,3)
3. CCI (20)
4. ADX (14)
5. AO
6. Momentum (10)
7. MACD (12,26)
8. Stoch RSI (3,3,14,14)
9. %R (14)
10. Bull bear
11. UO (7,14,28)
B. Moving Averages
1. SMA & EMA: 5-10-20-30-50-100-200
2. Ichimoku Cloud - Baseline (26)
3. Hull MA (9)
C. Pivot
1. Traditional
2. Fibonacci
3. Woodie
4. Camarilla
D. Summary
Sum_red=A_red+B_red+C_red
Sum_blue=A_blue+B_blue+C_blue
sell_point=(Sum_red/32)*100
buy_point=(Sum_blue/32)*100
sell =
Sum_red>Sum_blue
and sell_point>50
Strong_sell =
A_red>A_blue
and B_red>B_blue
and C_red>C_blue
and sell_point>50
and not crossunder(sell_point,75)
buy =
Sum_red>Sum_blue
and buy_point>50
Strong_buy =
A_red50
and not crossunder(buy_point,75)
neutral = not sell and not Strong_sell and not buy and not Strong_buy

Simple EMA_Hull_RSI StrategyAnother simple strategy. Crossing EMA & Hull MA and the level of RSI (overbought/oversold) defines long or short.
Can be improved by varying the parameters and adding take profit / stop loss.
Backtest: ETHUSD (Bitmex): 5m

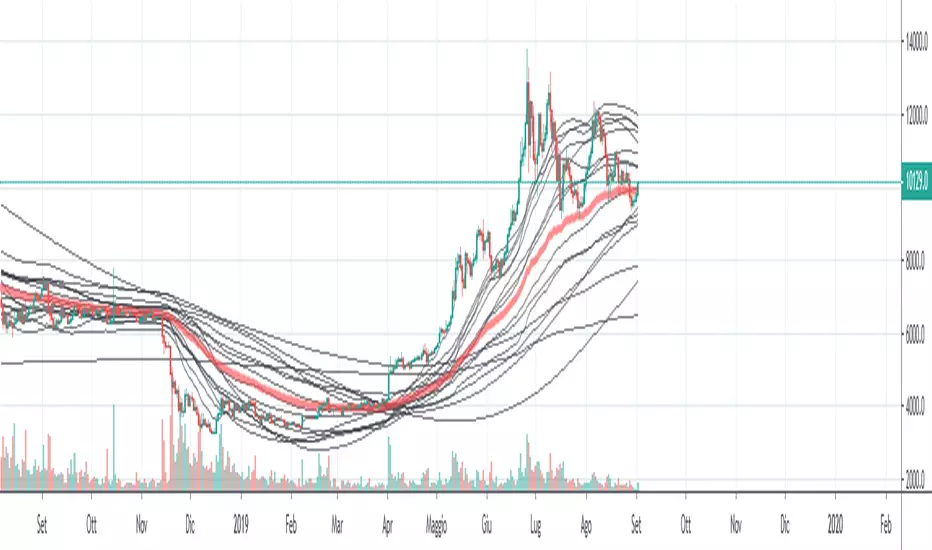
CBG Rainbow Moving AveragesHere's my Rainbow Moving Average indicator. There are 41 MAs. I also have cross over signals based on 2 separate MAs. I like to use 20 ahd 50 Hull MAs for the signals but you can set those up independently.


Triple Type Moving AverageThis script allows you to add three moving averages where the type of moving average can be chosen from 17 different moving average.
Moving Average Types:
// SMA Simple
// WMA Weighted
// VWMA Volume Weighted
// EMA Exponential
// DEMA Double EMA
// ALMA Arnaud Legoux
// HMA Hull MA
// SMMA Smoothed
// LSMA Least Squares
// KAMA Kaufman Adaptive
// TEMA Triple EMA
// ZLEMA Zero Lag
// FRAMA Fractal Adaptive
// VIDYA Variable Index Dynamic Average
// JMA Jurik Moving Average
// T3 Tillson
// TRIMA Triangular

Comparing different types of moving averagesA Study of Moving Average Types
// SMA Simple
// WMA Weighted
// VWMA Volume Weighted
// EMA Exponential
// DEMA Double EMA
// ALMA Arnaud Legoux
// HMA Hull MA
// SMMA Smoothed
// LSMA Least Squares
// KAMA Kaufman Adaptive
// TEMA Triple EMA
// ZLEMA Zero Lag
// FRAMA Fractal Adaptive
// VIDYA Variable Index Dynamic Average
// JMA Jurik Moving Average
// T3 Tillson
// TRIMA Triangular
Exponential Hull MA Oscillator PrototypeClamped EHMA Oscillator Prototype with 21/200 EHMA with additional JMA smoothing (Credit: @everget)
Note: This is an experiment - this is not a polished indicator

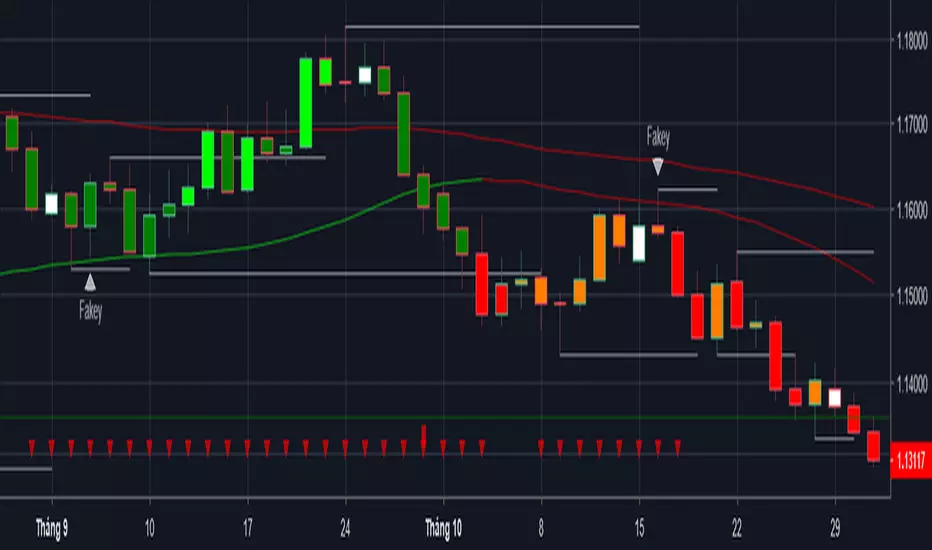
Price Action with MACD Barcolor + Insidebar + Fakey + Key level EMA 89 and Hull MA 89 used to filter trading signals and working as support and resistance.
When both of them are red, market is bearisk, only short.
When both of them are green, market is bullish, only long.
when there is 1 green and 1 red, market is neutral, can short or long.
Enjoy and happy trading!
You can follow me there: www.facebook.com you are welcom!
Moving Average Percent Difference by KIVANC fr3762Percent Difference between varios moving averages like sma , ema , wma , vwma and Hull MA and price to measure volatility and indicate crosses better.
1=SMA, 2=EMA, 3=WMA, 4=VWMA, 5=HullMA
Moving average type can be selected from the settings of the indicator.
the default value for the length of the moving averages taken as 50.
Author: KıvanÇ @fr3762 on twitter (tweets are only in TURKISH)
MAPD Fiyat ve çeşitli hareketli ortalamalar arası yüzde değeri hesaplamakta kullanılır.
indikatörle fiyatın kesişimlerini daha yi görmek ve bir çeşit volatilite ölçümü için de kullanılır.
Hareketli ortalamalar için varsayılan değer 50 bar olarak seçilmiştir/değiştirilebilir.
1=SMA, 2=EMA, 3=WMA, 4=VWMA, 5=HullMA olarak seçilebilir
İndikatörü geliştiren: Tim Tillson

FishNet hullMANot very useful because Hull MA is too lagless, defeating the original purpose of TusenPix's Fishnet SMA's using moving averages to determine S/R.
Looks good though.
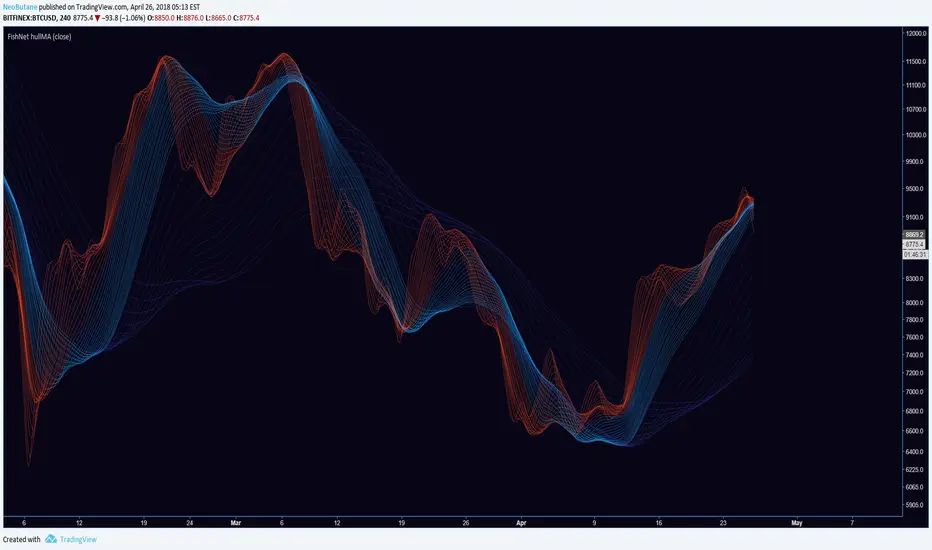
BTCbotLooks at more than just the BTC price, based off Hull MA
Attempt at reducing repaint by Averaging each candles Open-High-Low-Close and then using previous (not current) candle to calculate signal

ind4allAll indicators in one!
All indicators in one! Hull MA (2 colors) + Bollinger Bands + 6 EMA + 50 SMA + 200 SMA + Parabolic SAR + SUPER TREND (2 colors) + Doji signals (yellow) + RSI Over Bought / Over Sold indicator and Trend Trader Strategy..
